Pantip SET Sentiment Monitor
An automated NLP pipeline that scrapes Thai investor discussions from Pantip.com, links them to SET-listed tickers, scores sentiment with XLM-RoBERTa and serves a live Streamlit dashboard.

Summary
- Thai retail investors discuss SET stocks every day on Pantip.com, Thailand's largest public web forum — questions like "Should I buy DELTA right now?" — but that signal is unstructured, informal and never linked to the stocks it is about.
- A scheduled pipeline on free-tier infrastructure — Selenium scraper, 4-pass entity matcher, multilingual XLM-RoBERTa sentiment scoring, Turso database, Streamlit dashboard and a versioned Kaggle dataset — running end to end every 3 hours via GitHub Actions.
- A lag-correlation backtest (lags 0–5 days) found no consistent signal from Pantip sentiment to SET price moves — the project's main research finding. The published dataset scores 10.00/10.00 for Kaggle usability.
- 10.00 / 10.00
- 4 passes
- symbol, company name, alias, fuzzy
- ≥ 0.65
- about 2× the 3-class random baseline
- every 3 h
- GitHub Actions schedule
- 0–5 days
Project Summary
Pantip SET Sentiment Monitor is an automated NLP pipeline that mines Thai retail investor discussions from Pantip.com — Thailand’s largest public web forum — and scores them for sentiment against SET-listed stocks. Thai retail investors post there daily: questions like “Should I buy DELTA right now?” or opinions like “PTT is looking strong this week.” This project captures that signal, links each post to the stock it is talking about, and quantifies the mood.
The system runs entirely on free-tier infrastructure — GitHub Actions for scheduling, Turso (LibSQL) as a cloud database, and Streamlit Community Cloud for the dashboard — and refreshes automatically every 3 hours.
Automation Pipeline
Each scheduled run executes the full chain end to end: scrape → entity match → NLP inference → database write → Kaggle export. A local SQLite fallback is used during development when the Turso cloud database is not configured.
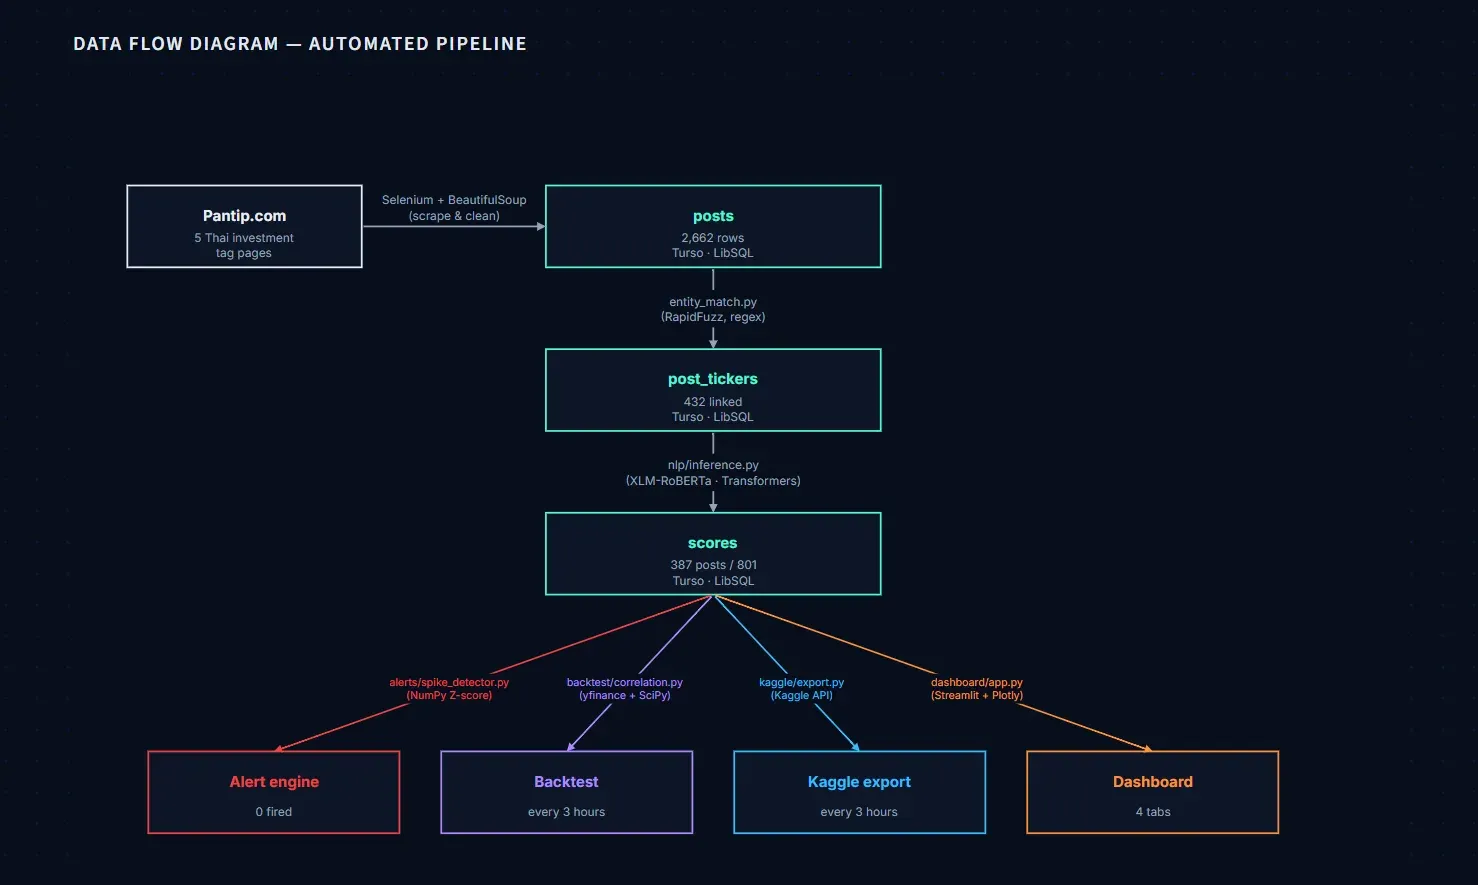
Collection. A Selenium-based scraper visits Pantip’s five investment tag pages and extracts post titles, reply counts, and timestamps. Because Pantip renders both timestamps and reply counts via JavaScript rather than raw HTML, a separate AJAX endpoint was reverse-engineered to recover accurate reply counts, and a multi-strategy timestamp parser handles Open Graph tags, JSON-LD, and data attributes. A circuit breaker and randomised delays between requests handle page-load failures and rate limits gracefully.
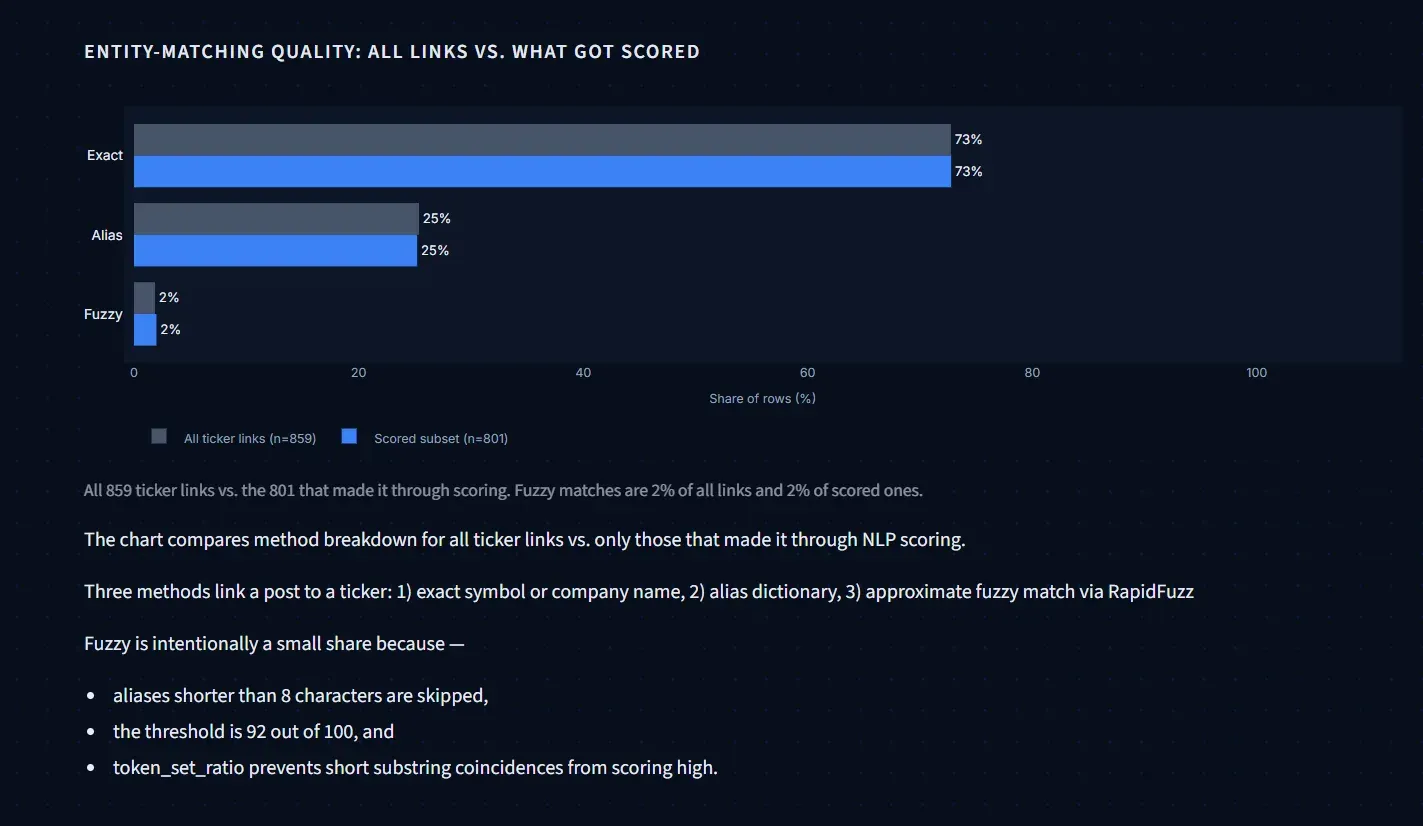
Entity matching. A 4-pass linker runs on each post body: (1) exact ticker symbol match, (2) full Thai company name match, (3) alias dictionary lookup covering about 50 hand-curated Thai nicknames, and (4) RapidFuzz approximate matching on PyThaiNLP-tokenised text at a threshold of 92. Each match records the method used and a confidence score. Aliases shorter than 8 characters are excluded from fuzzy matching to prevent short strings matching inside unrelated long posts.
Sentiment scoring. Posts are scored with
cardiffnlp/twitter-xlm-roberta-base-sentiment — a multilingual XLM-RoBERTa
model fine-tuned on Twitter data across 30+ languages including Thai. Each post
body is tokenised and passed through the model in batches; the winning class
becomes the label (positive / neutral / negative) and its softmax probability
the confidence score. Only predictions with confidence ≥ 0.65 are stored —
roughly 2× the random-chance baseline of 0.33 for a 3-class model.
Storage and analysis. Results are written to a Turso (LibSQL) cloud database across 6 normalised tables: posts, post_tickers, scores, alerts, prices, and kaggle_exports. A z-score (≥ 2.5σ) and volume-surge (3× the 7-day average) anomaly detector runs after scoring to flag statistically significant sentiment spikes. A Pearson/Spearman lag-correlation engine then fetches daily closing prices from yfinance and computes sentiment-to-price lag correlations for each ticker.
Analysis & Findings
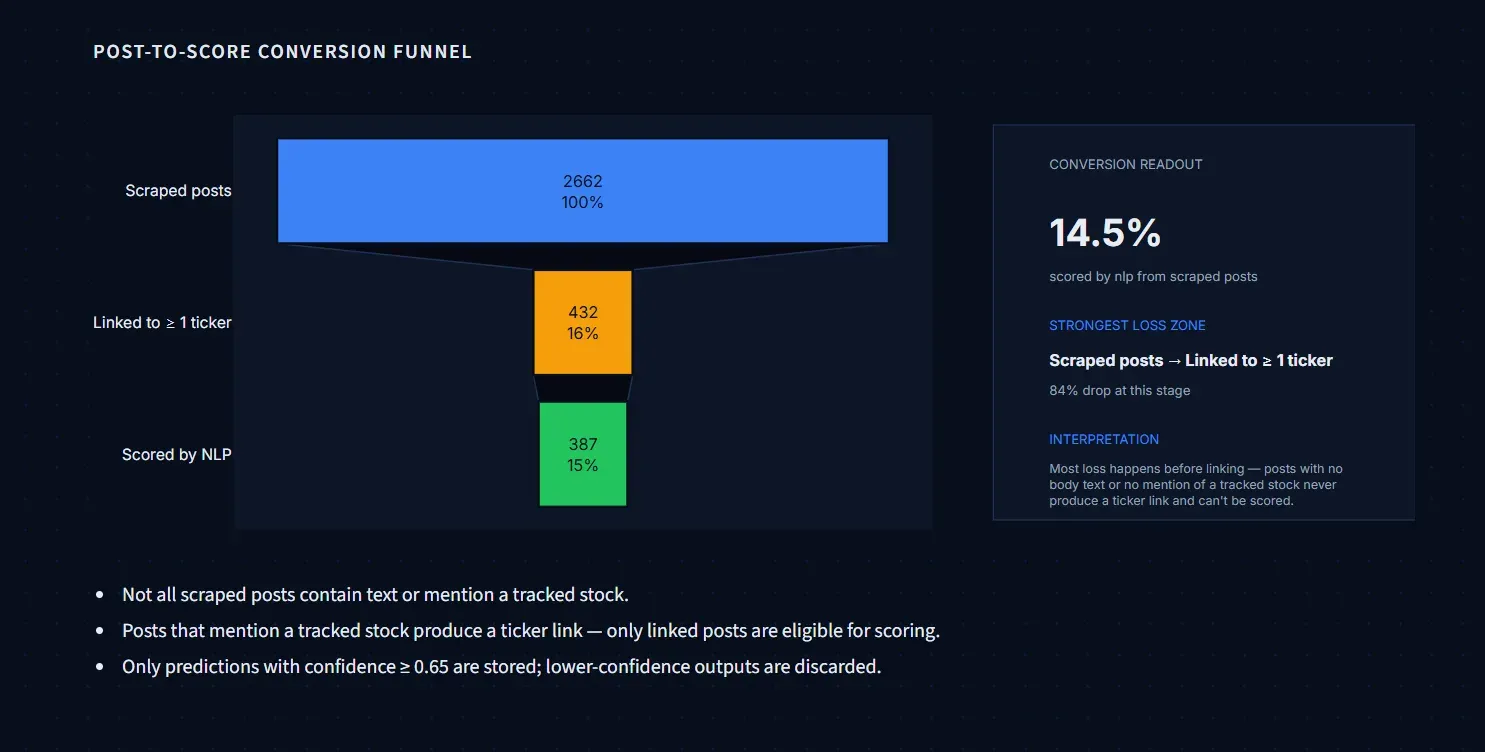
The pipeline conversion funnel shows that most data loss happens before entity linking — not during NLP scoring. Posts with no body text or no mention of a tracked ticker are dropped at the linking stage and never reach the model, so the scored dataset is a filtered subset of scraped posts, not a complete record of all Pantip investment discussion.
Entity matching is dominated by exact symbol matches, which pile up at 1.0 confidence because the ticker appeared literally in the post text. Fuzzy matches account for roughly 2% of all links and carry lower, more spread-out confidence scores — the alias dictionary and fuzzy pass catch genuine mentions that exact matching would miss, but contribute a small fraction of the total.
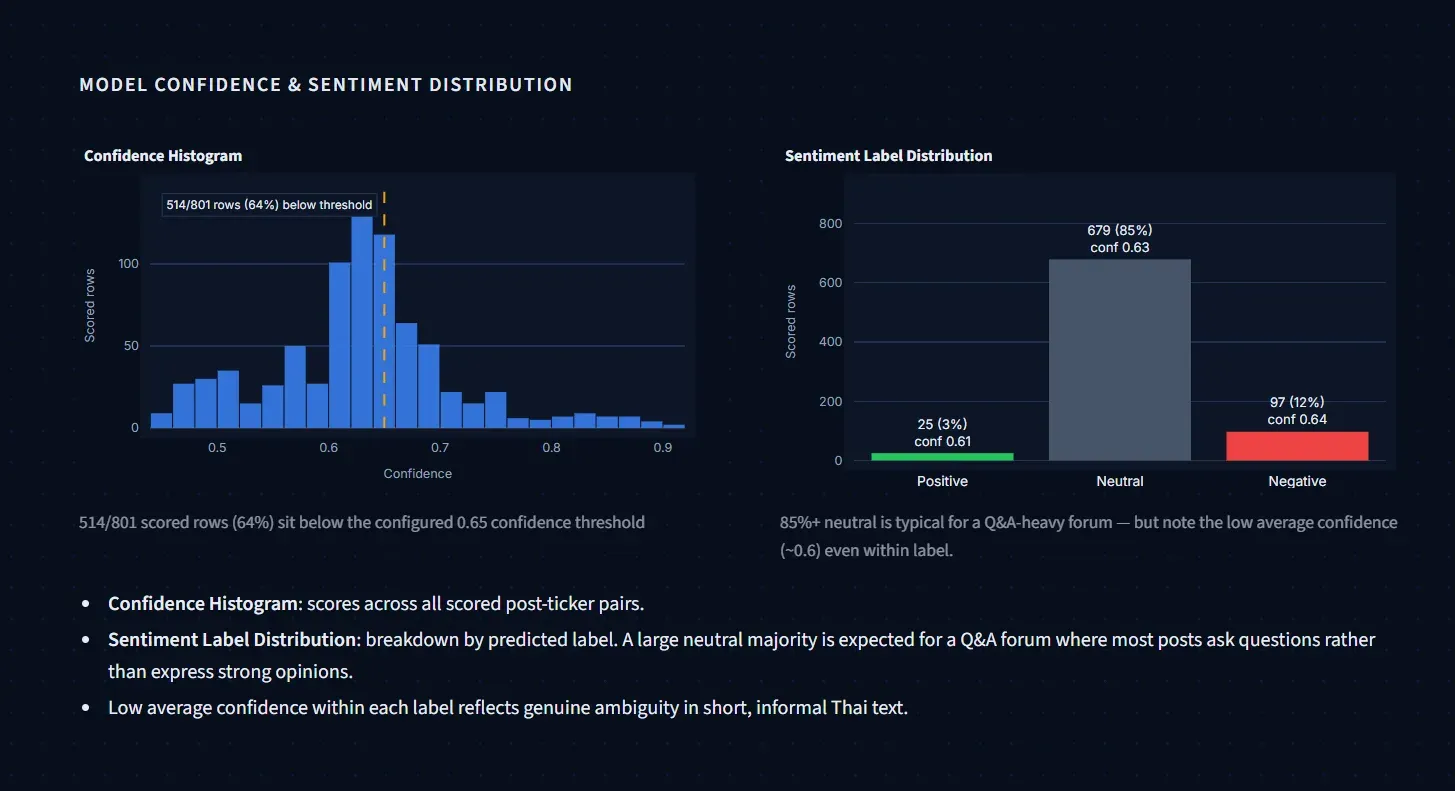
Model confidence shows minimal difference between positive, neutral, and negative predictions. That reflects genuine ambiguity in short, informal Thai text rather than poor performance; for the most reliable analysis, filtering to confidence ≥ 0.85 is recommended. Approximately 85% of posts are classified as neutral. This is expected — Pantip’s investment boards are predominantly Q&A style, where most threads ask questions rather than express strong directional opinions — and the posts with positive or negative labels carry the analytical signal.
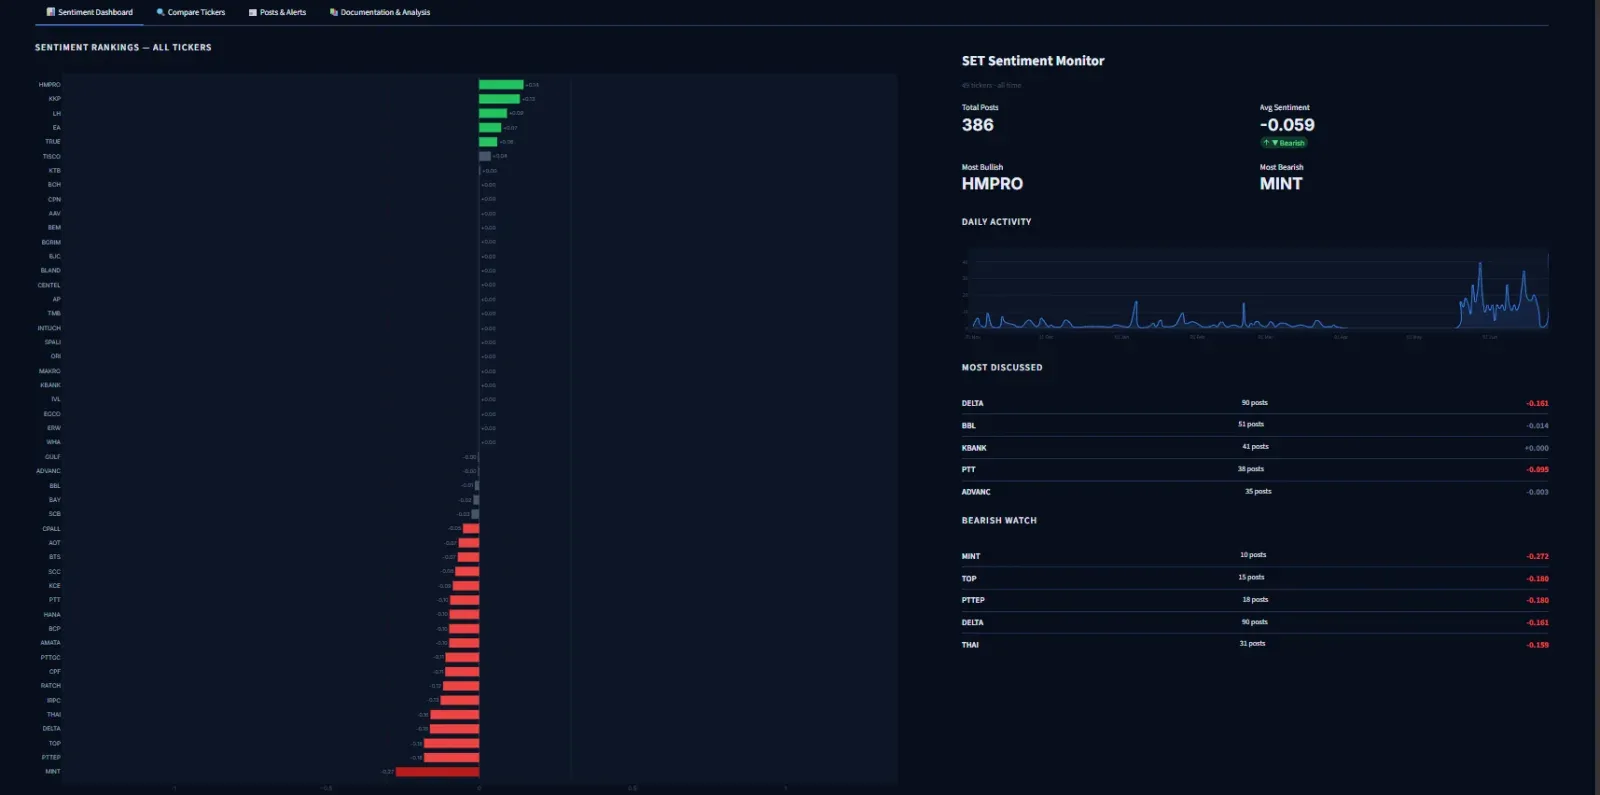
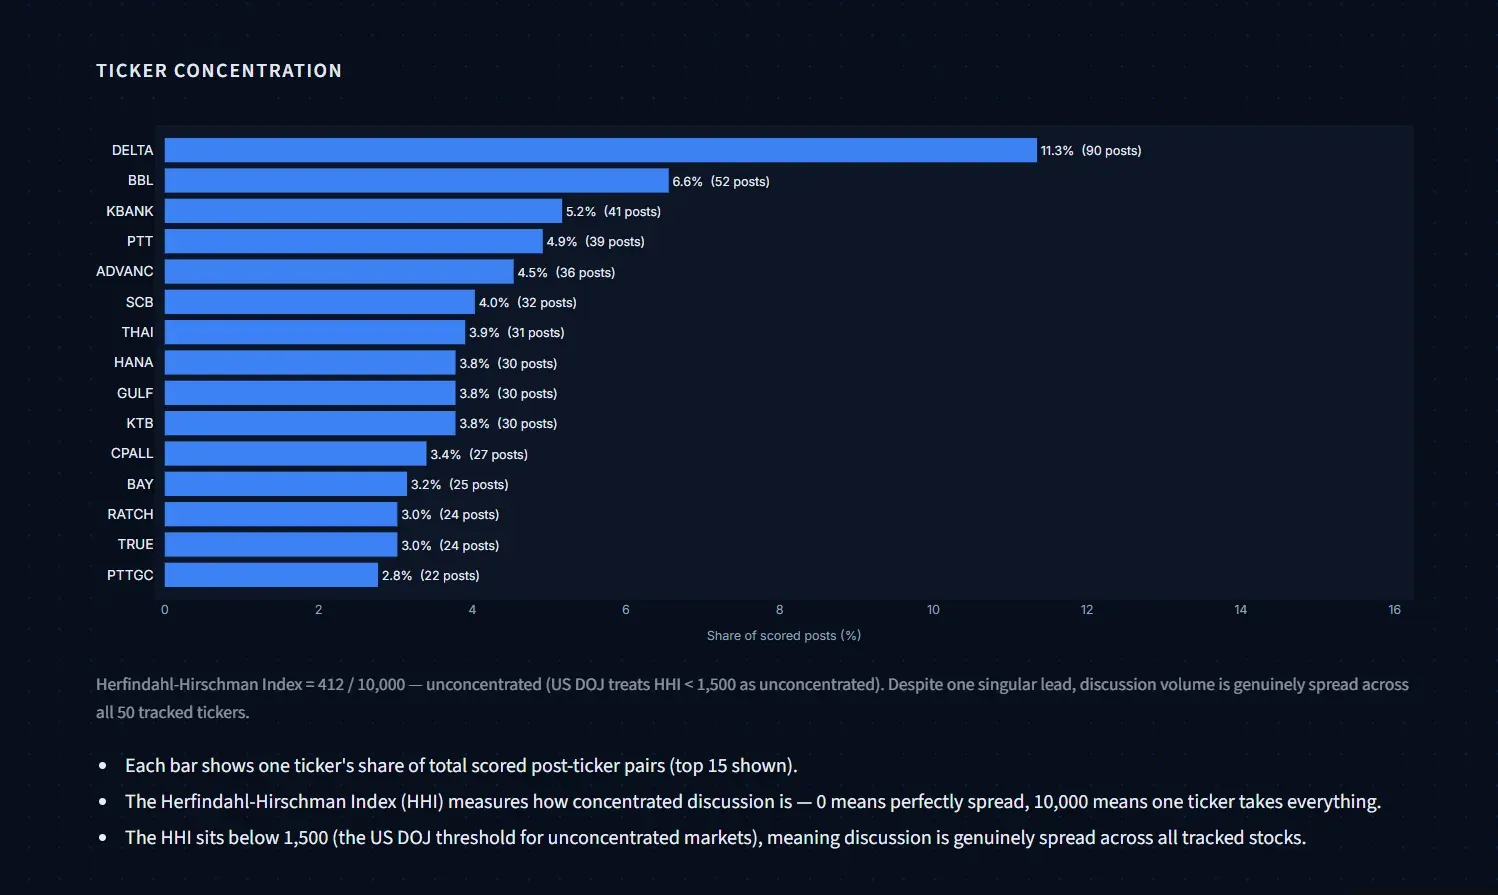
Ticker concentration analysis using the Herfindahl-Hirschman Index (HHI) shows that a small number of high-profile tickers — particularly large-cap stocks like DELTA, PTT, and KBANK — account for a disproportionate share of discussion volume. Sentiment for tickers with fewer than 10 posts should be treated with caution, as a single strong opinion can skew the average.
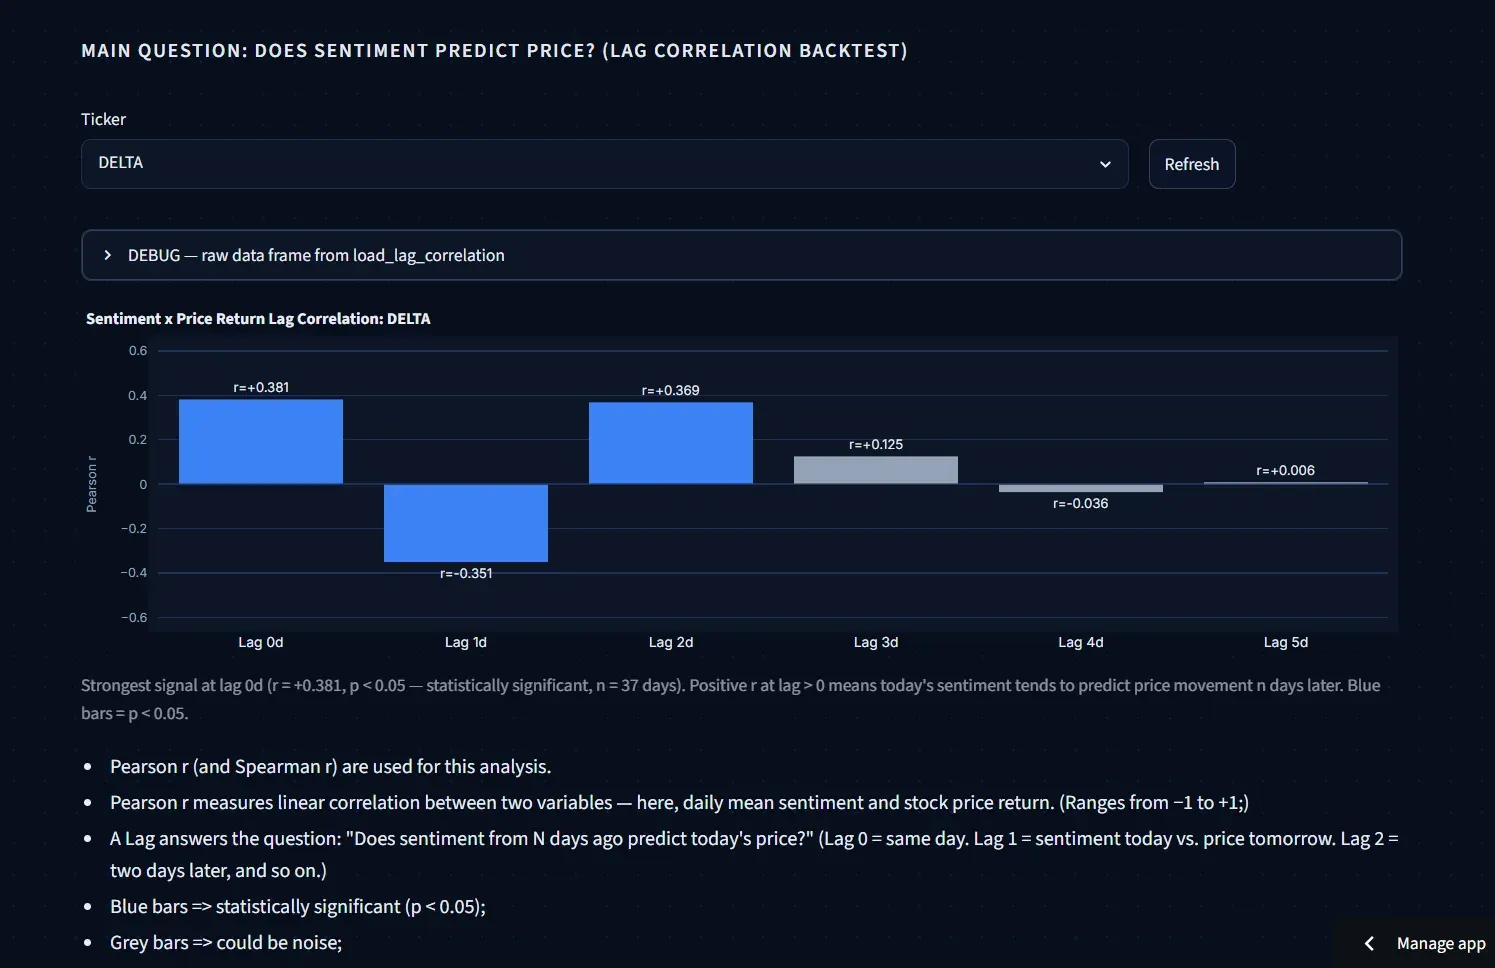
The lag-correlation backtest across lags 0–5 days between daily sentiment aggregates and yfinance closing-price returns found no consistent predictive signal for any ticker. Correlation coefficients clustered near zero across all lags, suggesting that Pantip retail sentiment in its current form does not reliably lead SET price movement. This is the main research finding of the project.
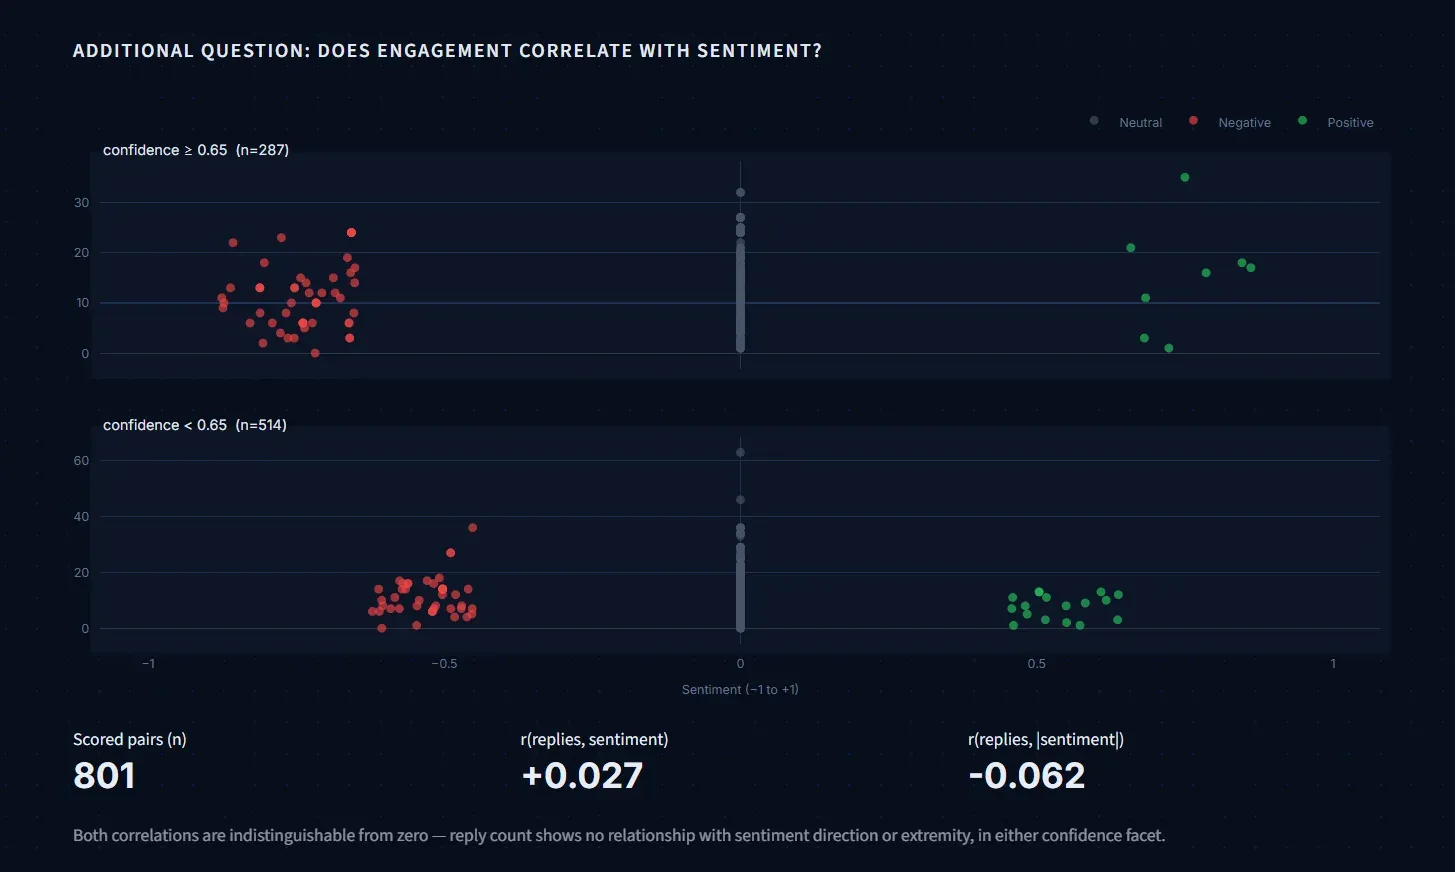
Engagement analysis found no meaningful relationship between reply count and sentiment direction or intensity (Pearson r ≈ 0). Posts on Pantip do not attract more comments simply because they are more negative or more emotionally charged — discussion volume appears driven by topic relevance rather than sentiment polarity.
Kaggle Dataset & Notebook
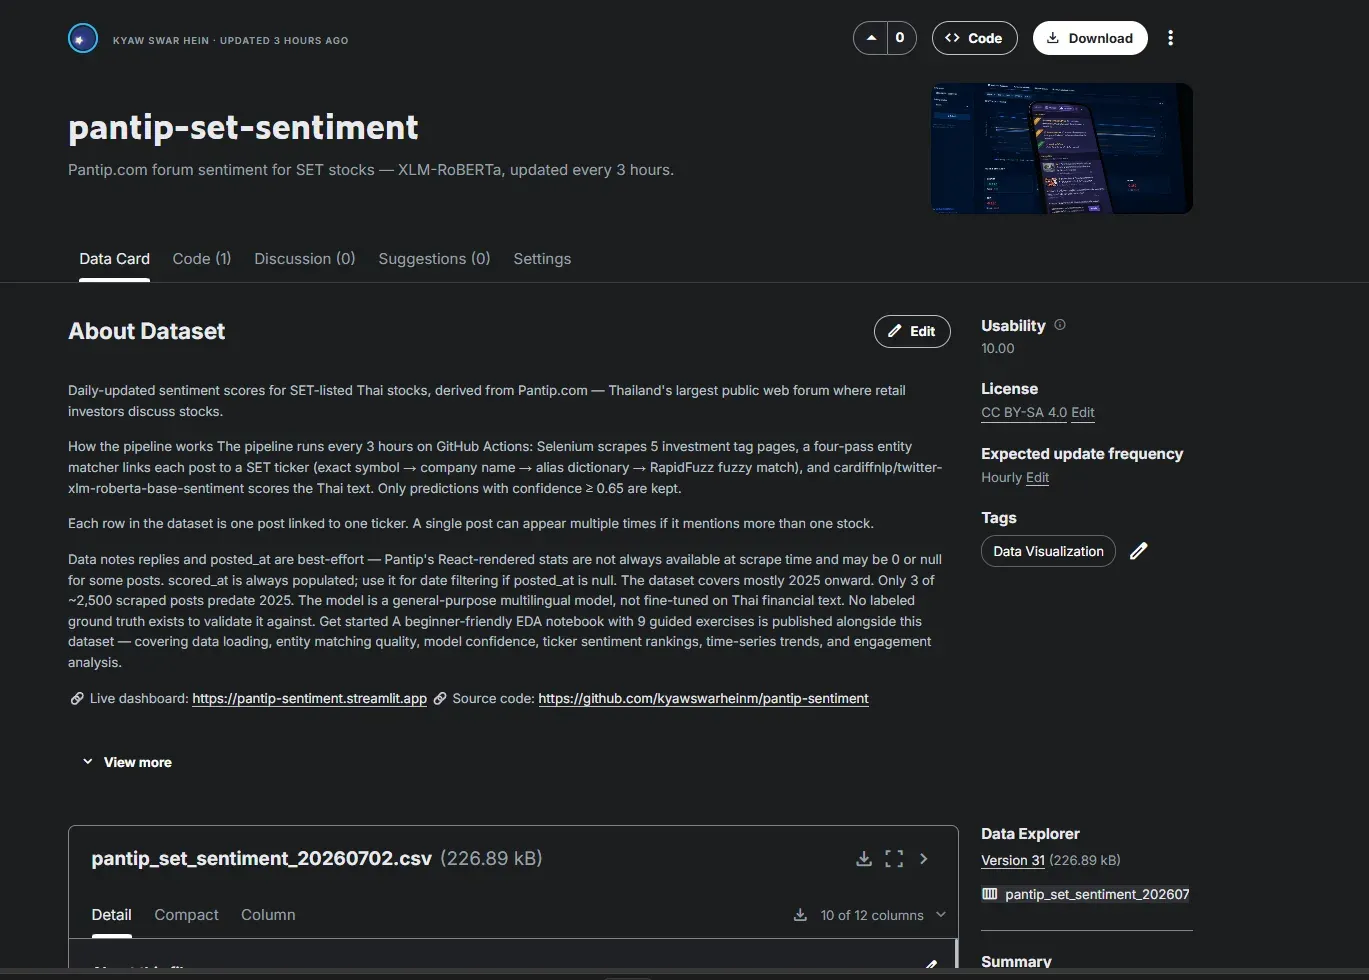
The scored dataset is exported to Kaggle on every pipeline run as a versioned, dated CSV. Each export contains 12 columns: post_id, title_th, url, replies, posted_at, ticker, match_confidence, match_method, sentiment, confidence, label, and scored_at. The dataset is published under CC BY-SA 4.0 and achieved a 10.00/10.00 Kaggle usability score.
A beginner-friendly EDA notebook is published alongside the dataset with 9 guided exercises across three difficulty levels: data loading and date handling, entity-matching quality, model confidence, ticker sentiment rankings, time-series trends, engagement correlation, day-of-week patterns, a ticker-by-month sentiment heatmap, and a lag-1 sentiment-to-volume prediction test.
Resources
- Pantip SET Sentiment · CC BY-SA 4.0 (opens in a new tab)Versioned CSV exported on every pipeline run, with a companion EDA notebook.