Customer Behavior Analysis with YOLOv26
An end-to-end retail computer vision system that detects pre-purchase shelf behavior with a custom-trained YOLO model — mAP@50 60.91% across 4 interaction classes on 12,578 frames.

Summary
- Most retail analytics only track completed transactions. What customers do before a sale — touching the shelf, picking up an item, removing it, or walking past without engaging — goes unmeasured.
- A custom-trained Ultralytics YOLO model behind a React + FastAPI stack turns raw shelf video into interaction events, 8 operational KPIs, a planogram-based interaction overlay and product-level engagement metrics.
- A working end-to-end prototype built from scratch — custom dataset, annotation, tracking logic and dashboard — that surfaces attention hotspots and high-touch, low-conversion shelf positions.
- 60.91%
- 72.69%
- 58.95%
- 25.25%
- 12,578
- from 11 real retail video clips
- 4
- No Interaction, Touching Shelf, Holding Product, Item Removed
Project Summary
Customer Behaviour Analysis is a retail computer vision project that measures pre-purchase shelf behavior — the customer activity that happens before a sale is ever recorded. Most retail analytics platforms only track completed transactions. This system goes earlier in the decision funnel, detecting how customers physically interact with products: touching the shelf, picking up an item, removing it, or walking past without engaging.
Built on a custom-trained Ultralytics YOLO model and a React + FastAPI stack, the platform transforms raw shelf video into operational KPIs, a planogram-based interaction overlay, and product-level engagement metrics — giving retail managers a data layer that point-of-sale systems cannot provide.
Architecture
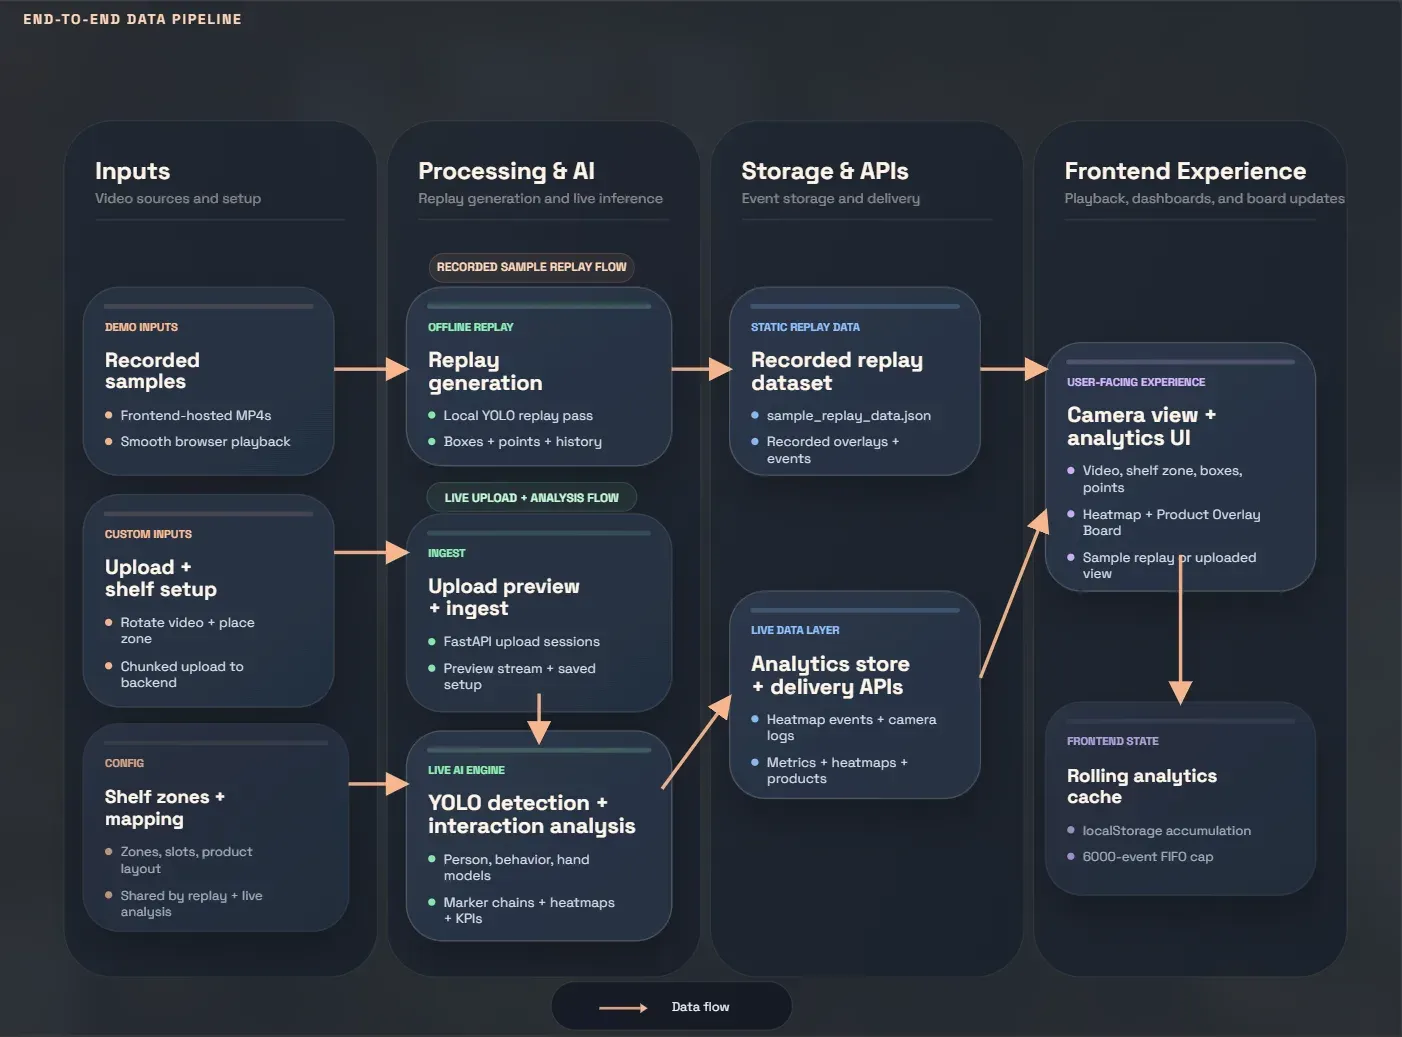
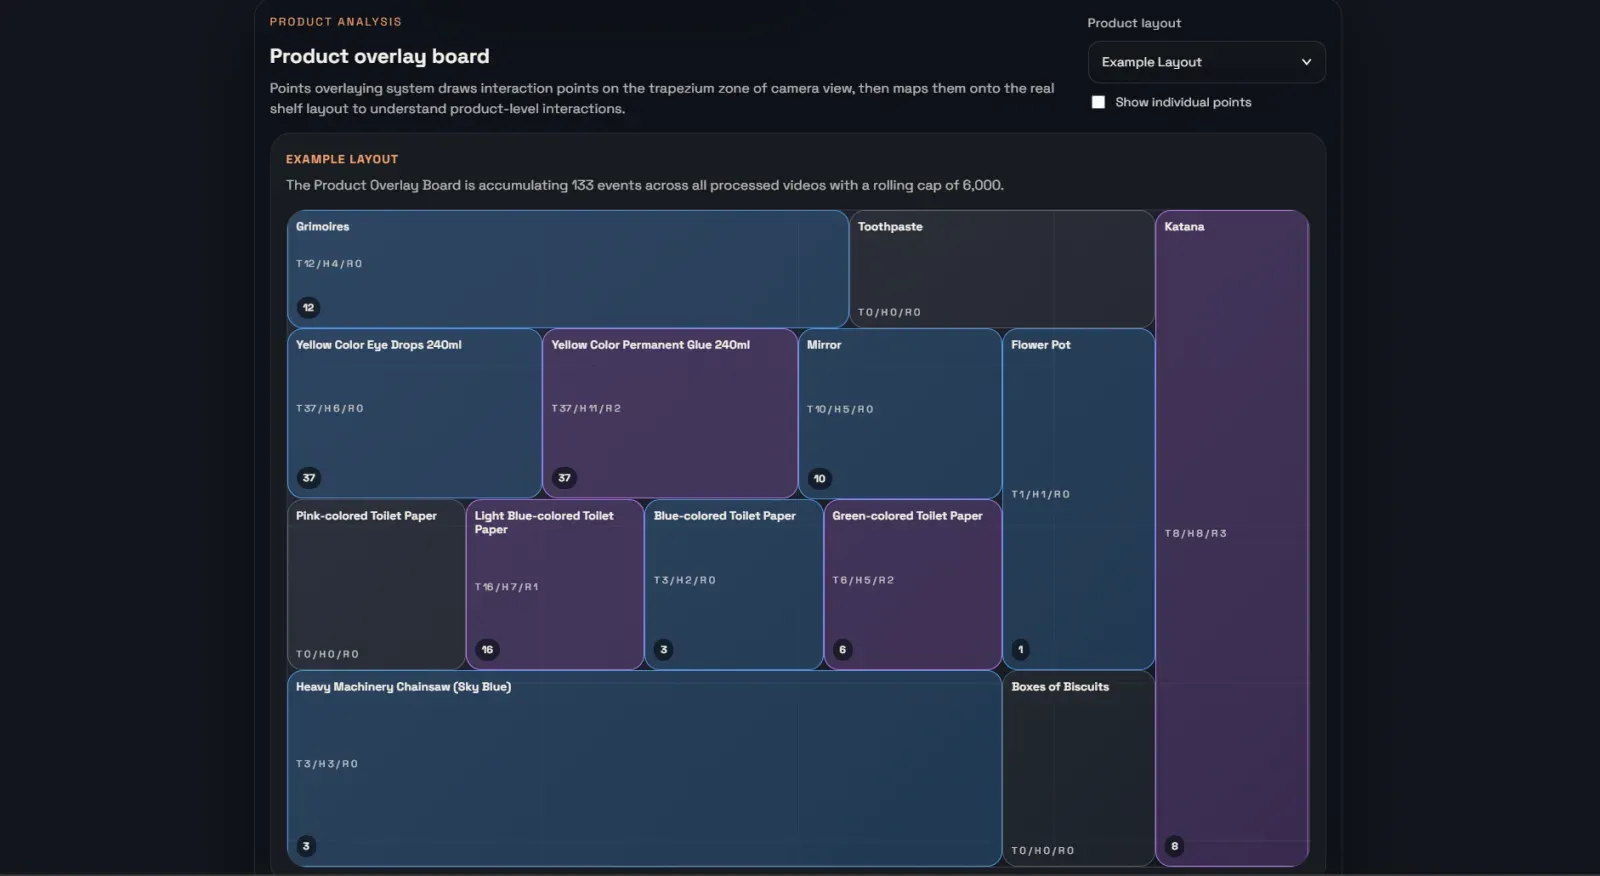
Detection outputs pass through an interaction-tracking layer that assigns stable interaction points to shelf zones and links them to product placement data. This enables per-product attention scoring and identification of low-conversion shelf regions — not just raw detection counts.
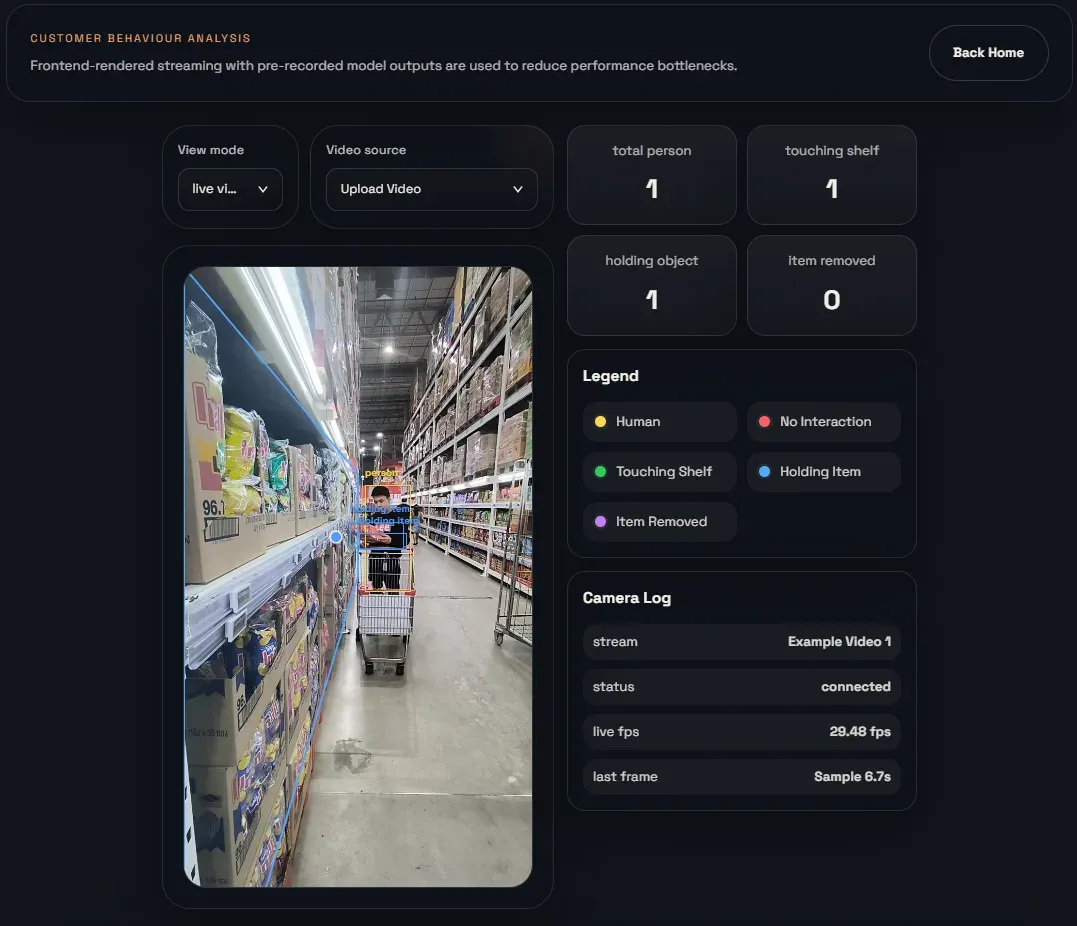
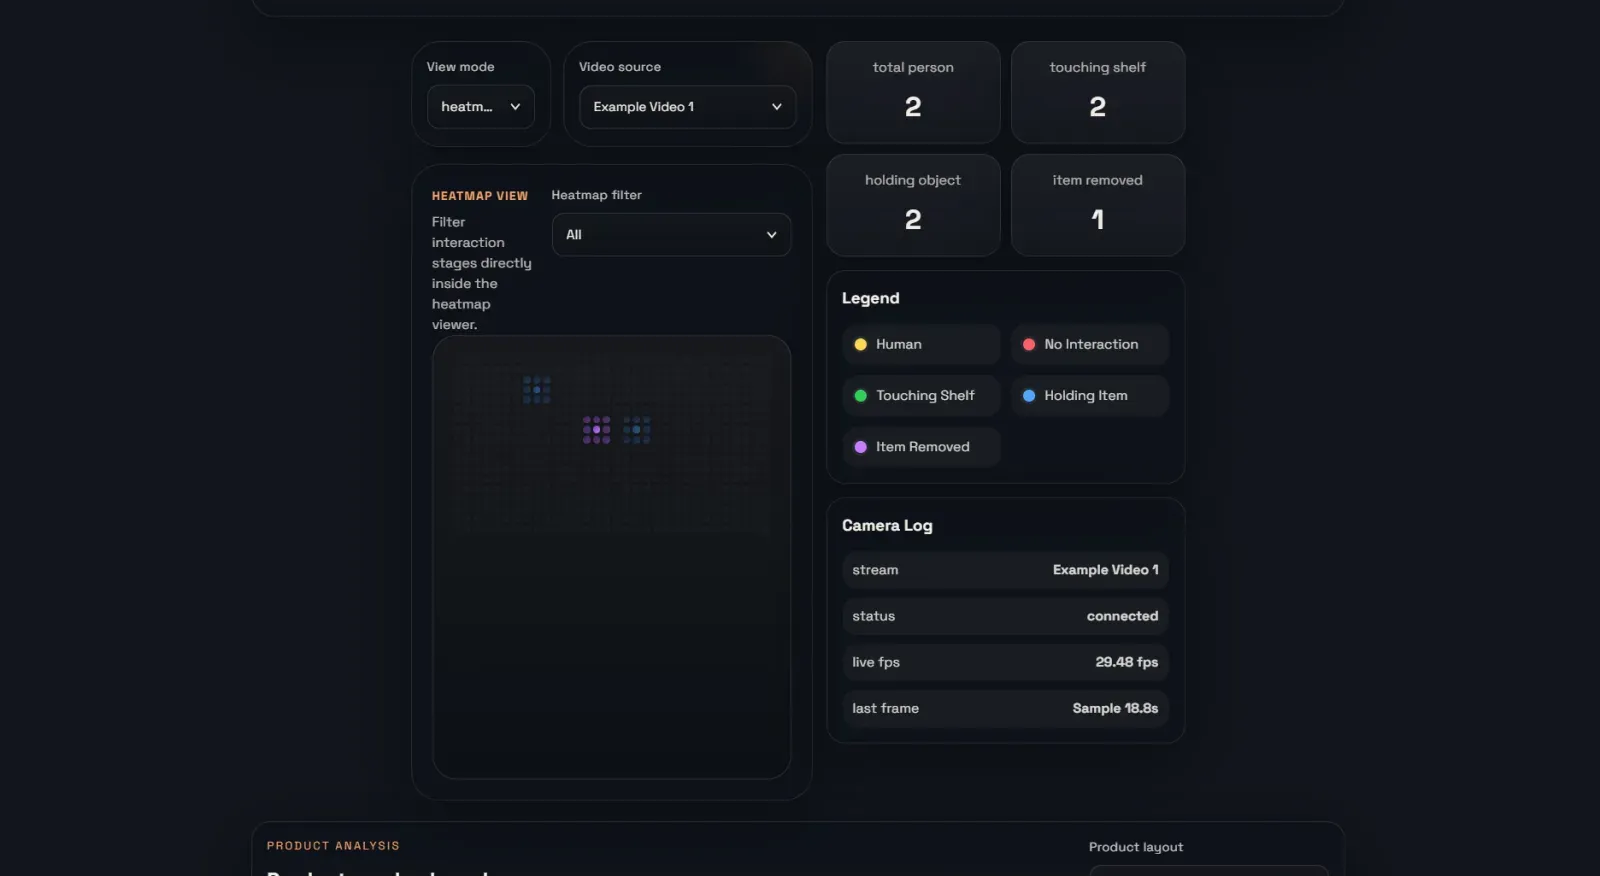
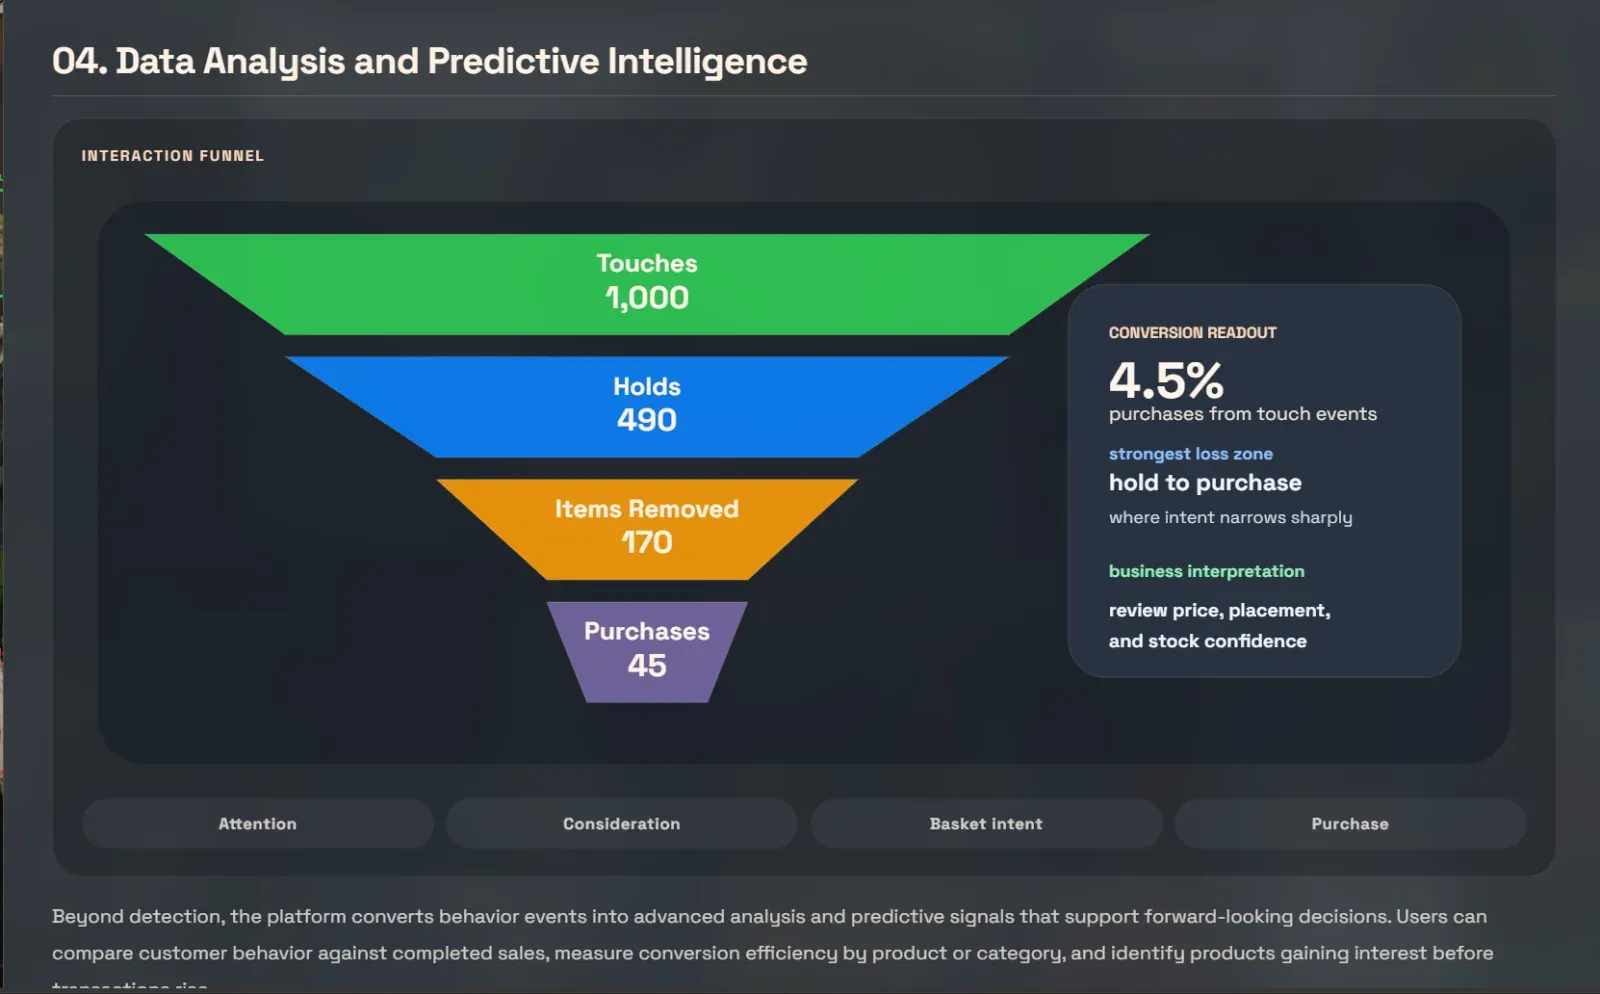
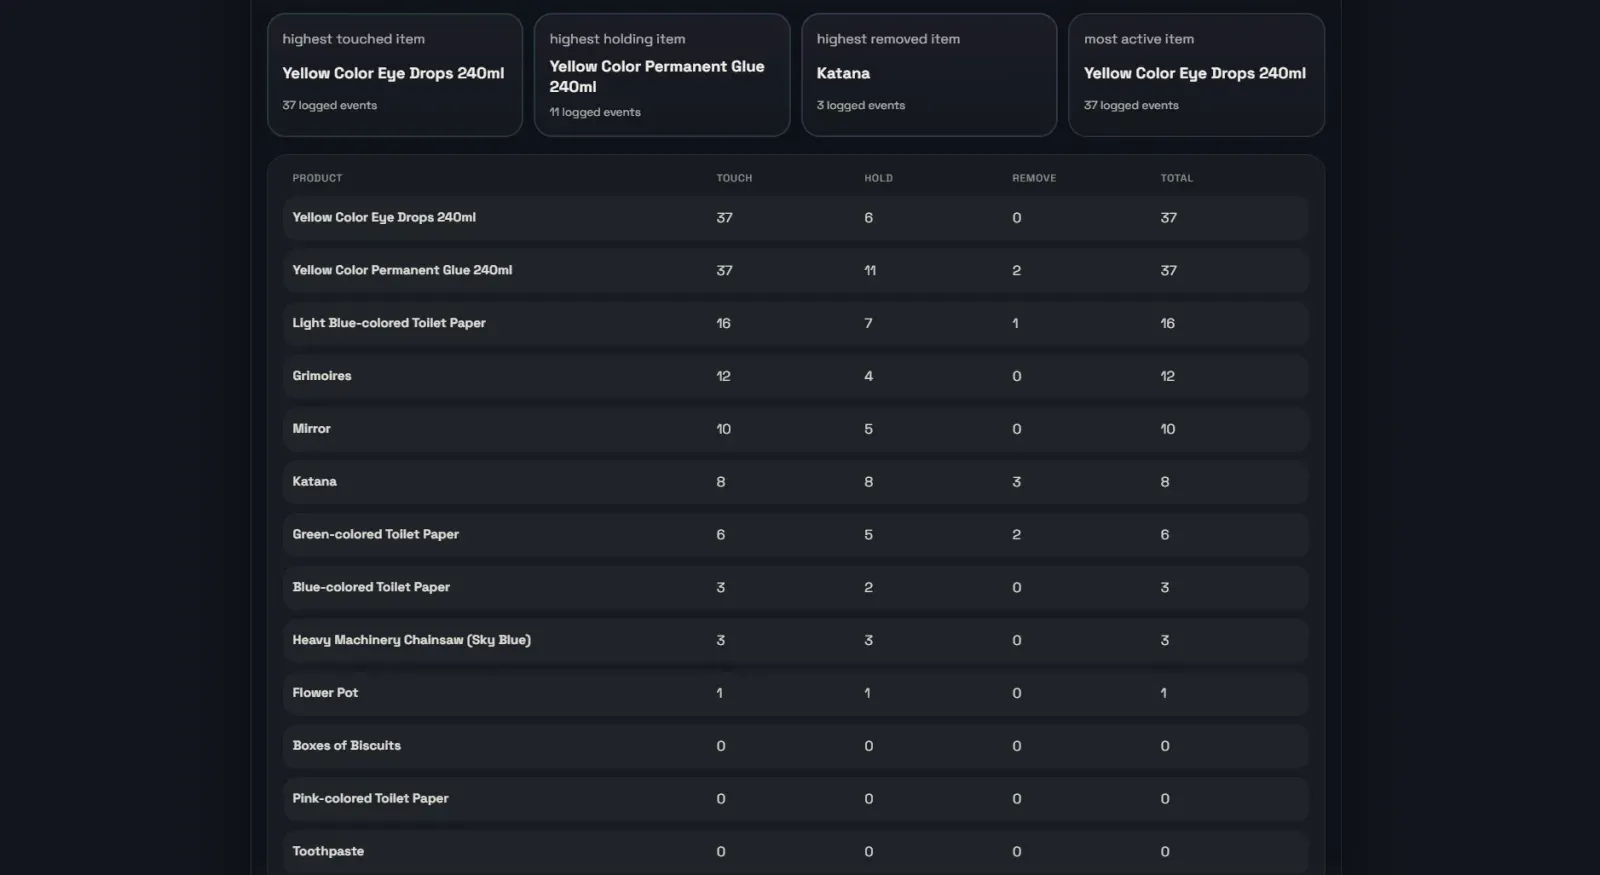
The FastAPI backend handles inference orchestration, event processing, analytics aggregation, and REST API delivery. The React frontend renders camera playback with shelf overlays, dot-matrix interaction maps, a planogram-based interaction overlay, a behavior-to-purchase conversion funnel, and a treemap for product-level engagement comparison across 8 operational KPIs.
Model Training
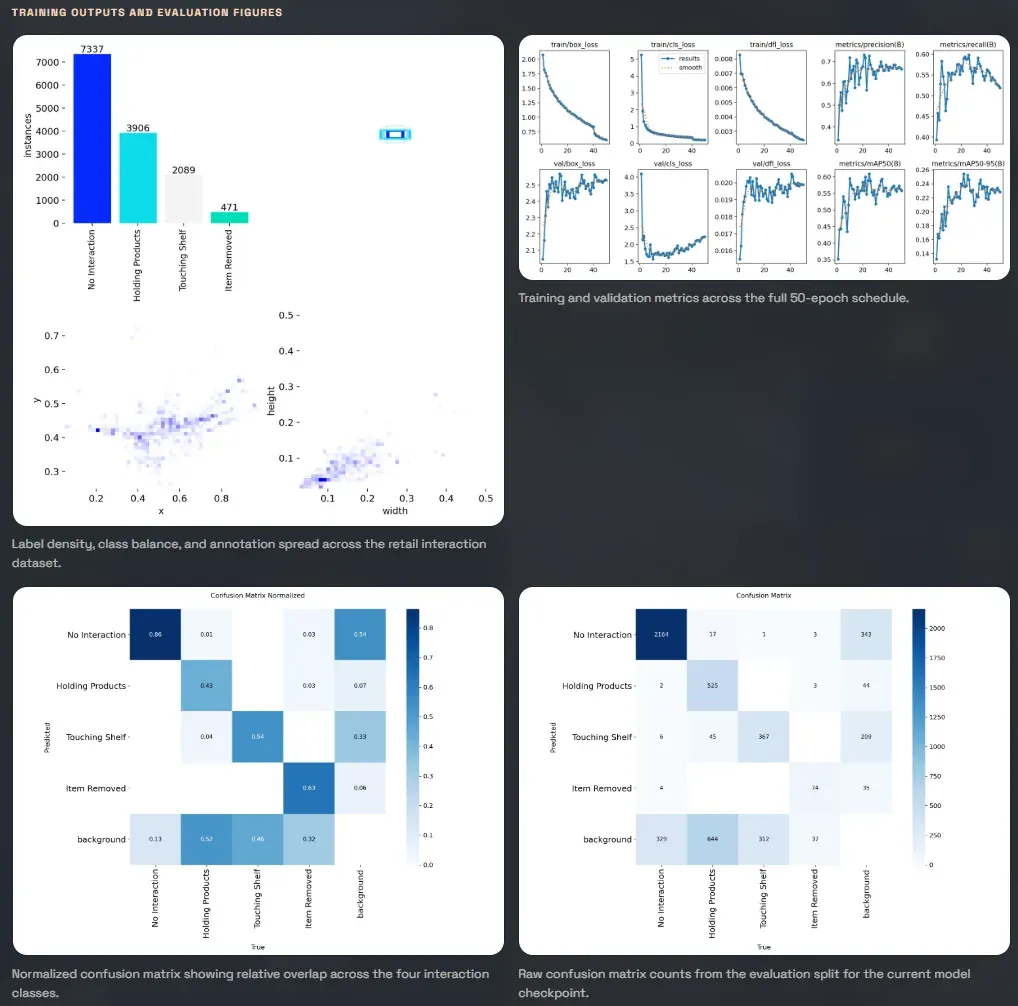
The detection model was trained on 12,578 frames extracted from 11 real retail video clips, covering 4 interaction classes: No Interaction, Touching Shelf, Holding Product, and Item Removed. Training used Ultralytics YOLO with a custom annotated dataset built specifically for shelf-facing retail environments.
Evaluation
| Metric | Value |
|---|---|
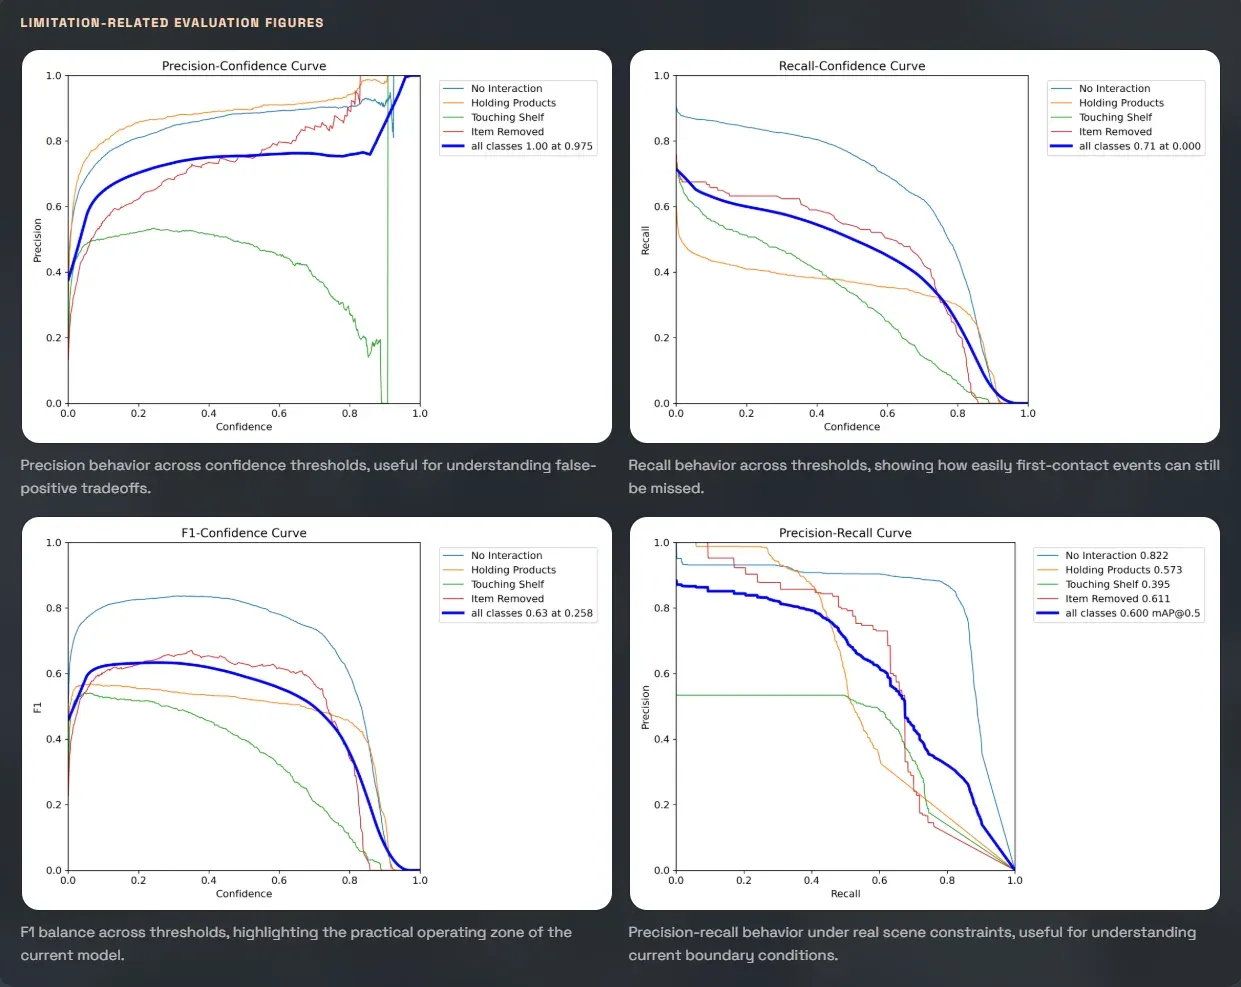
| Precision | 72.69% |
| Recall | 58.95% |
| mAP@50 | 60.91% |
| mAP@50-95 | 25.25% |
Dashboard
Outcome
The result is a working end-to-end prototype that demonstrates how computer vision can move beyond object detection into applied retail decision support. Specific outputs include identification of attention hotspots by shelf zone, detection of high-touch but low-conversion product positions, and behavioral trend analysis across interaction classes.
The project was built entirely from scratch — custom dataset, custom annotation pipeline, custom tracking logic, and custom dashboard — without relying on pre-labeled retail datasets or off-the-shelf analytics templates. A walkthrough video is on LinkedIn.
Research and Inspiration
The project was inspired by Customer Object Interaction Analytics in Retail Using YOLOv5 Object Detection.