CiMSO Data Visualization Dashboard
1st Place at the CiMSO Hospitality ERP Hackathon 2025 — a manager-centred analytics platform with 25 Chart.js visualizations, 45 KPIs, five languages and an LLM-powered insight assistant.

Summary
- Teams received CiMSO ERP datasets and were challenged to build analytics that genuinely help hotel managers make faster, better-informed decisions — from a dataset large and varied enough that deciding what not to show mattered most.
- A Node.js + Express platform with 25 Chart.js visualizations across 9 dashboard categories and 45 KPIs, time-period filtering, raw-data tables, colour-blind-friendly palettes, five-language support and an LLM assistant with text-to-speech and speech-to-text.
- 1st Place out of 11 finalist teams, judged on design clarity, business insight and live presentation; later selected for public showcase at the RSU Job Fair 2026.
- 1st of 11
- finalist teams, CiMSO Hospitality ERP Hackathon 2025
- 25
- Chart.js charts
- 45
- across 9 dashboard categories
- 5
- English, Thai, Malay, Traditional Chinese, Burmese
Overview
This project was built for the CiMSO Hospitality ERP Hackathon 2025 — a competition where teams were given access to CiMSO ERP datasets and challenged to build analytics tools that would genuinely help hotel managers make faster, more informed decisions.
The core design goal was not to visualize everything the data contained, but to surface what a manager actually needs: the right KPIs, grouped logically, with filters that match how operational decisions get made. The platform won 1st Place out of 11 finalist teams, judged on design clarity, business insight quality, and live presentation.
Design Decisions
Chart selection, information grouping, and interaction flow were treated as primary design challenges — not secondary polish. The dataset was large and varied, so the first task was deciding what not to show, which categories mattered most, and which chart types would minimize cognitive load while maximizing insight speed.
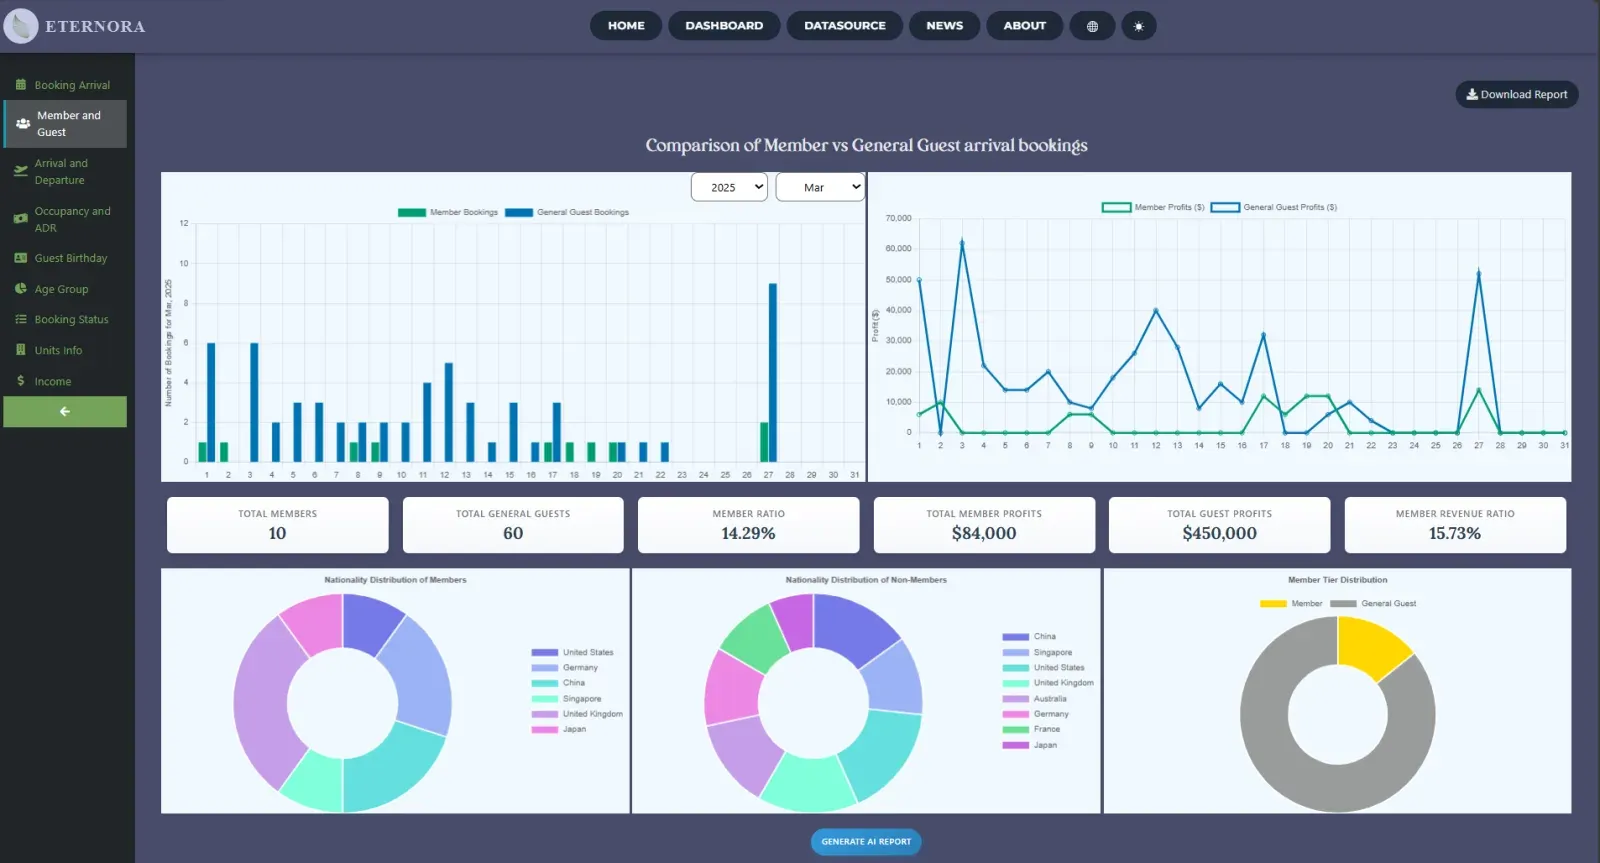
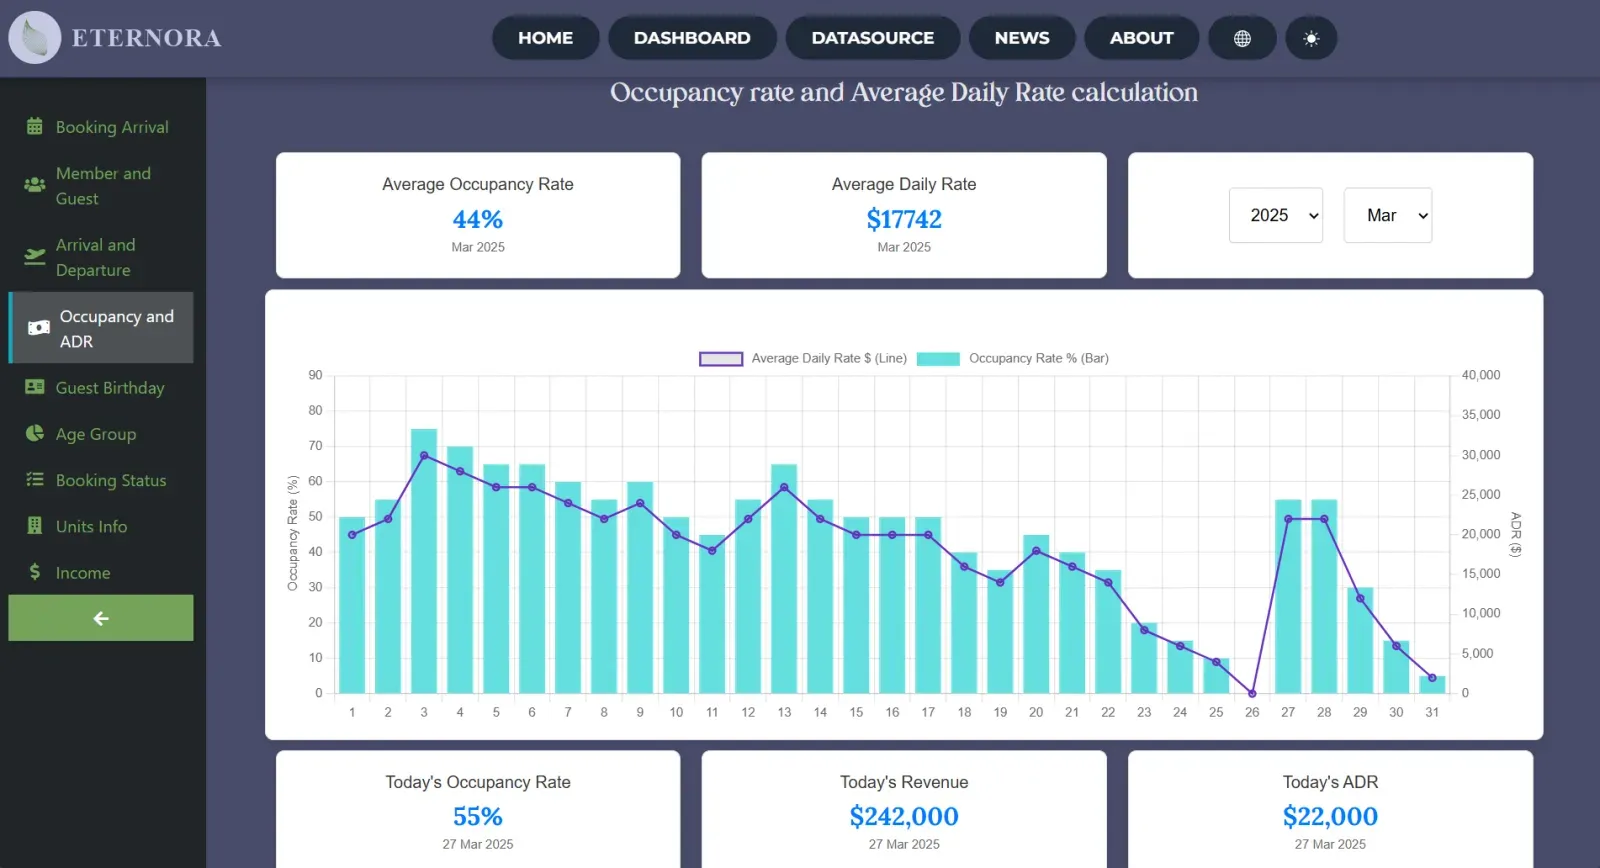
The interface was structured around 9 dashboard categories — booking arrivals, members and guests, arrivals and departures, occupancy and ADR, guest birthdays, age groups, booking statuses, unit information, and income. Within these, 45 KPIs were surfaced with time-period filtering, allowing managers to shift between daily, weekly, and monthly views without navigating away from their context.
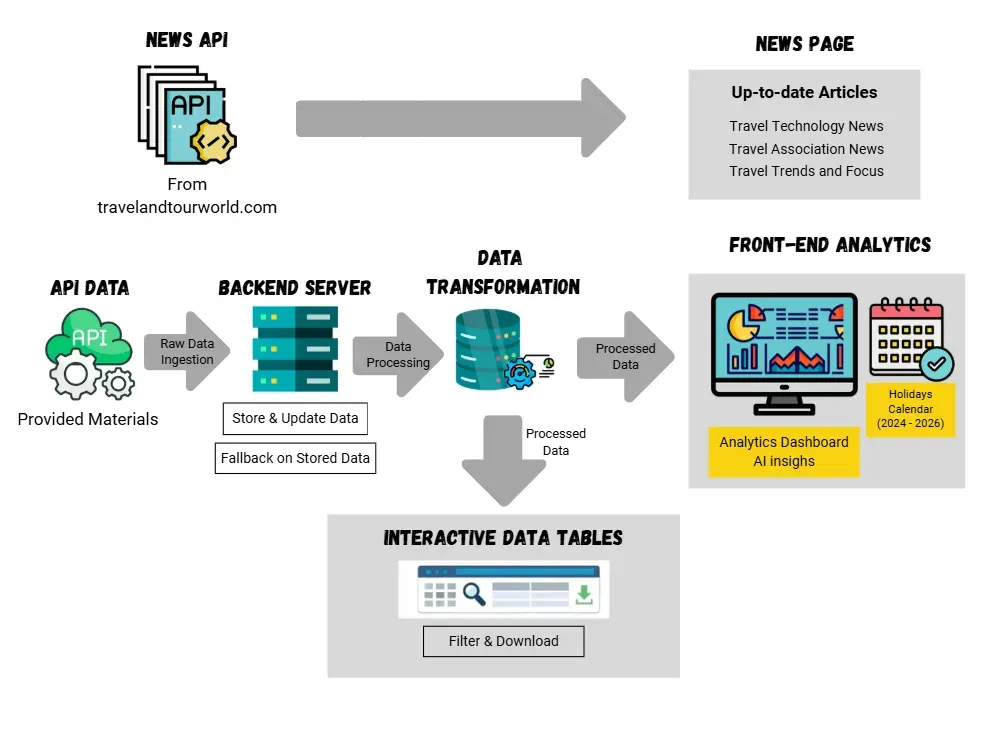
A daily travel news feed was embedded directly into the dashboard so managers could stay informed of industry developments — tariff changes, travel trends, regional events — without switching tools.
Features
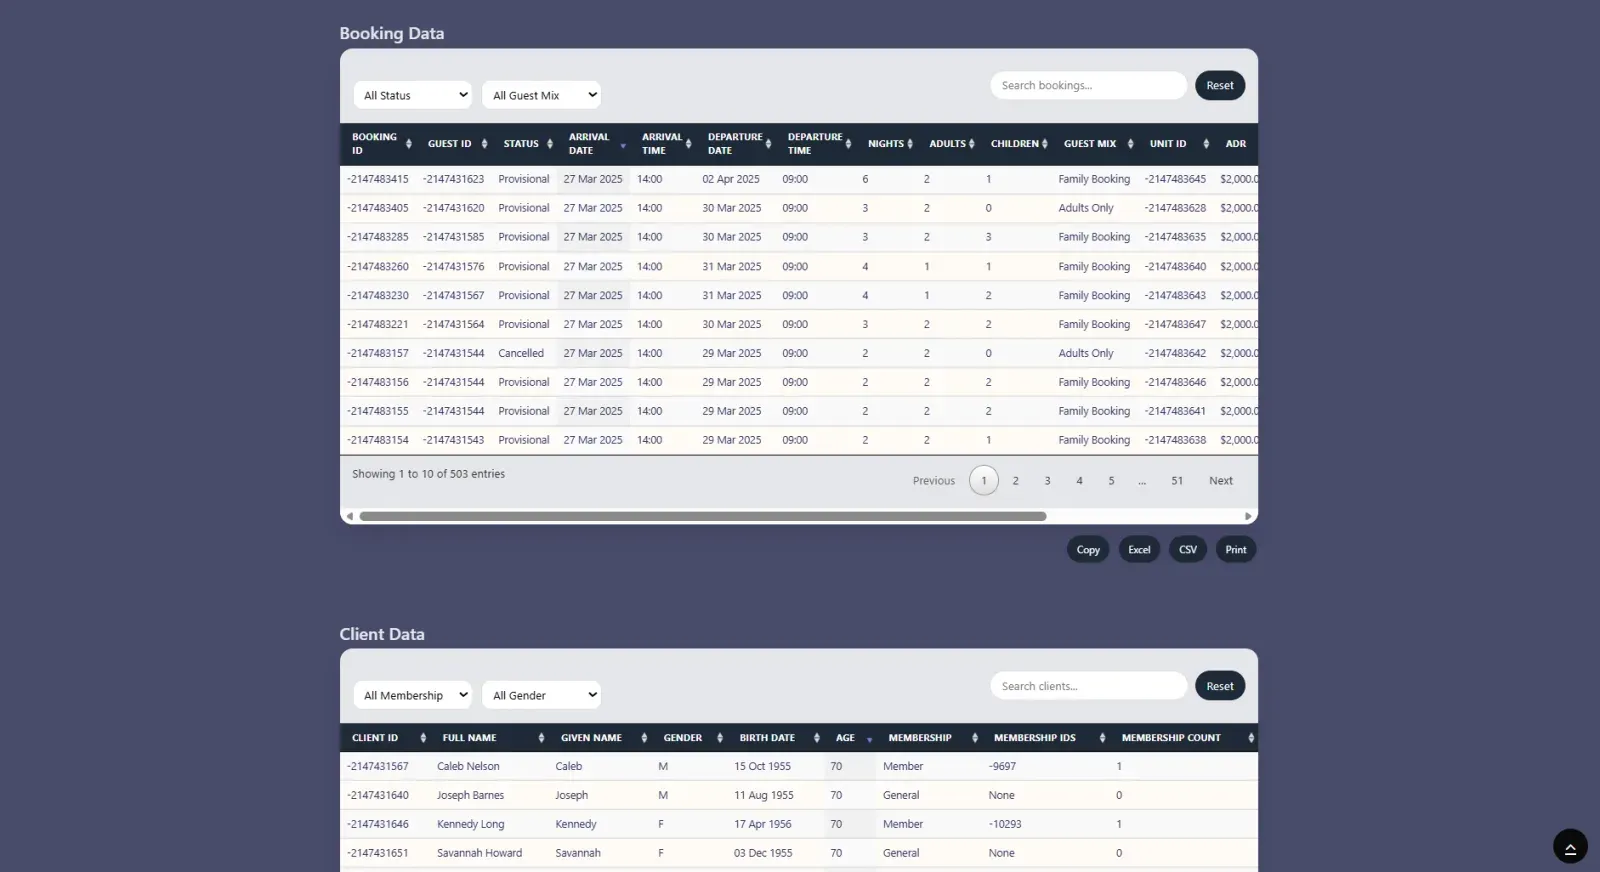
The platform includes 25 Chart.js visualizations with flexible time-period and category filtering, a raw data table view for record-level inspection, color-blind-friendly chart palettes, and light and dark mode themes.
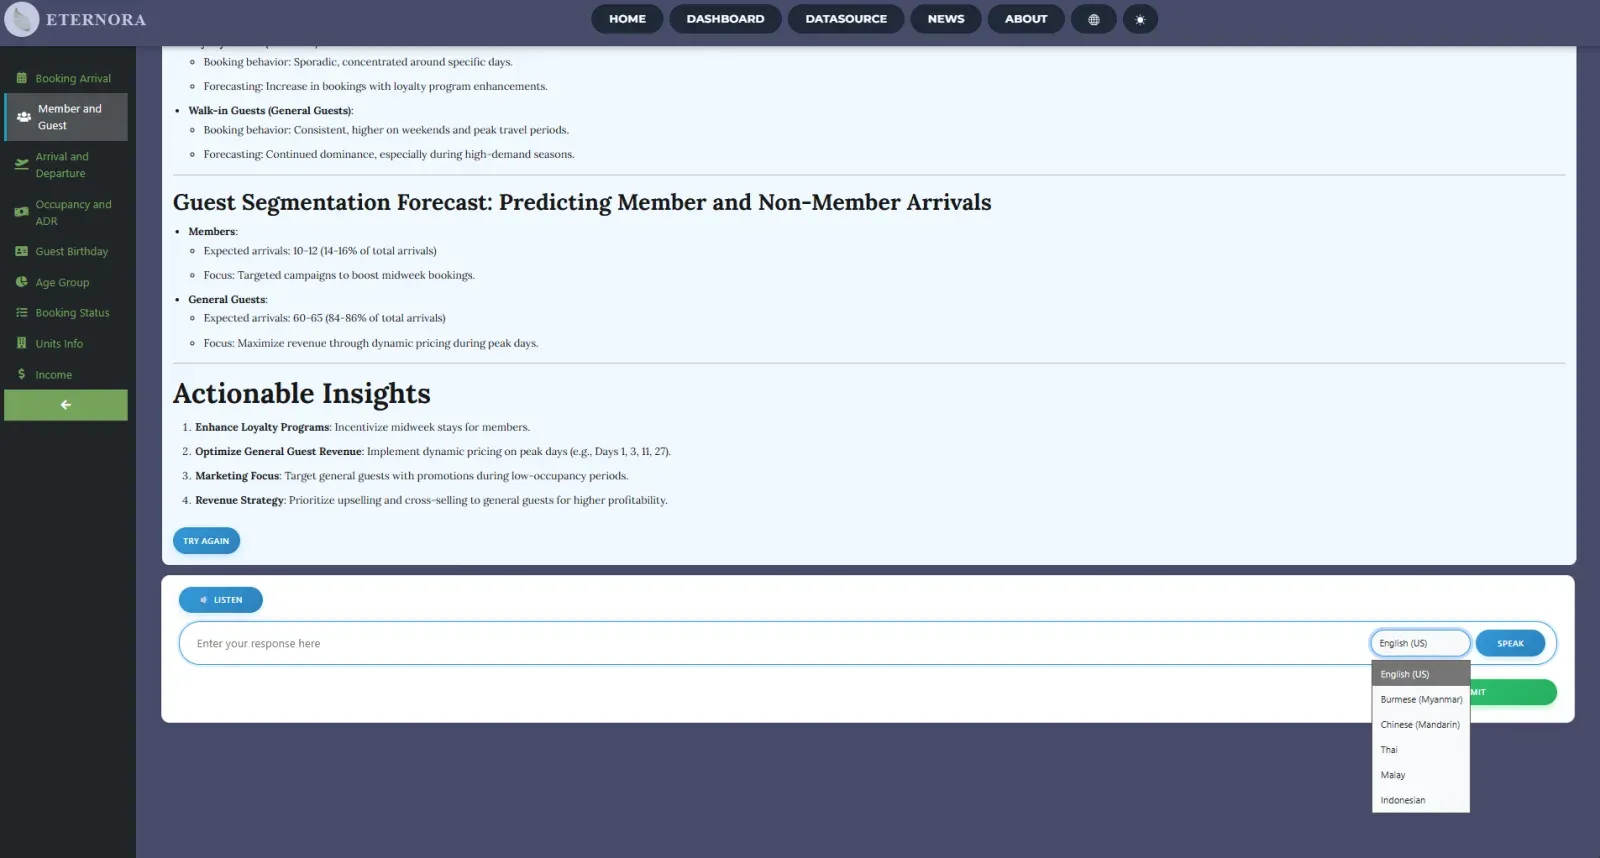
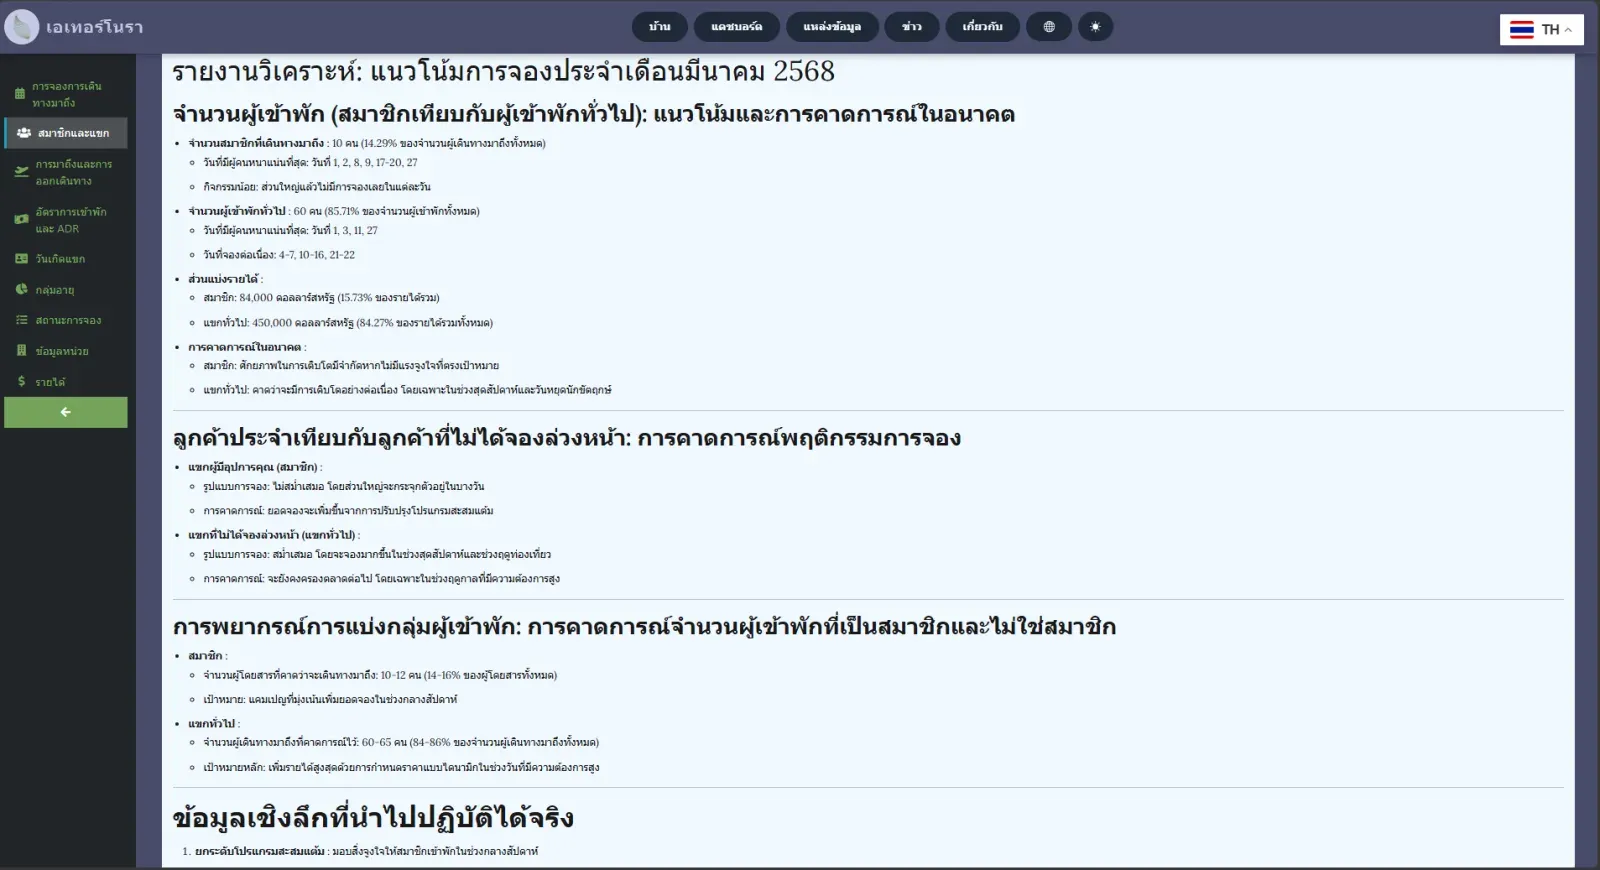
The hypothetical hotel franchise spans five countries. To support regional managers, the dashboard integrates Google Translate for five languages: English, Thai, Malay, Traditional Chinese, and Burmese. Translation extends fully to AI-generated content, not just static UI text.
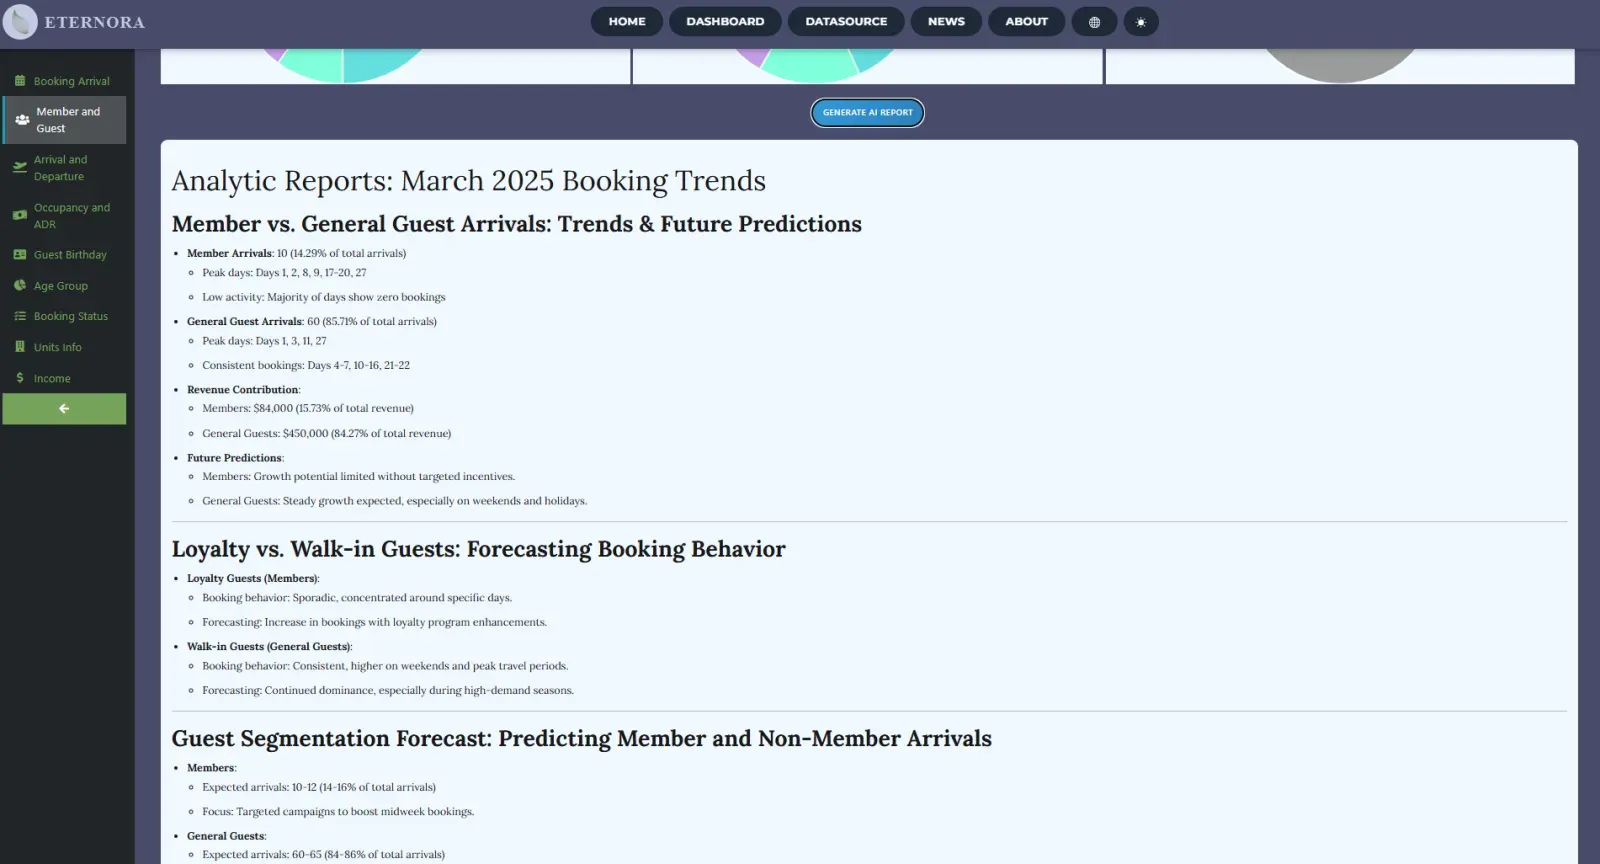
An LLM-powered AI assistant generates data-specific insights, summaries, and follow-up analysis questions based on the active dashboard view. It supports text-to-speech output and speech-to-text input across all five languages — making the tool accessible to managers regardless of reading preference or language background.
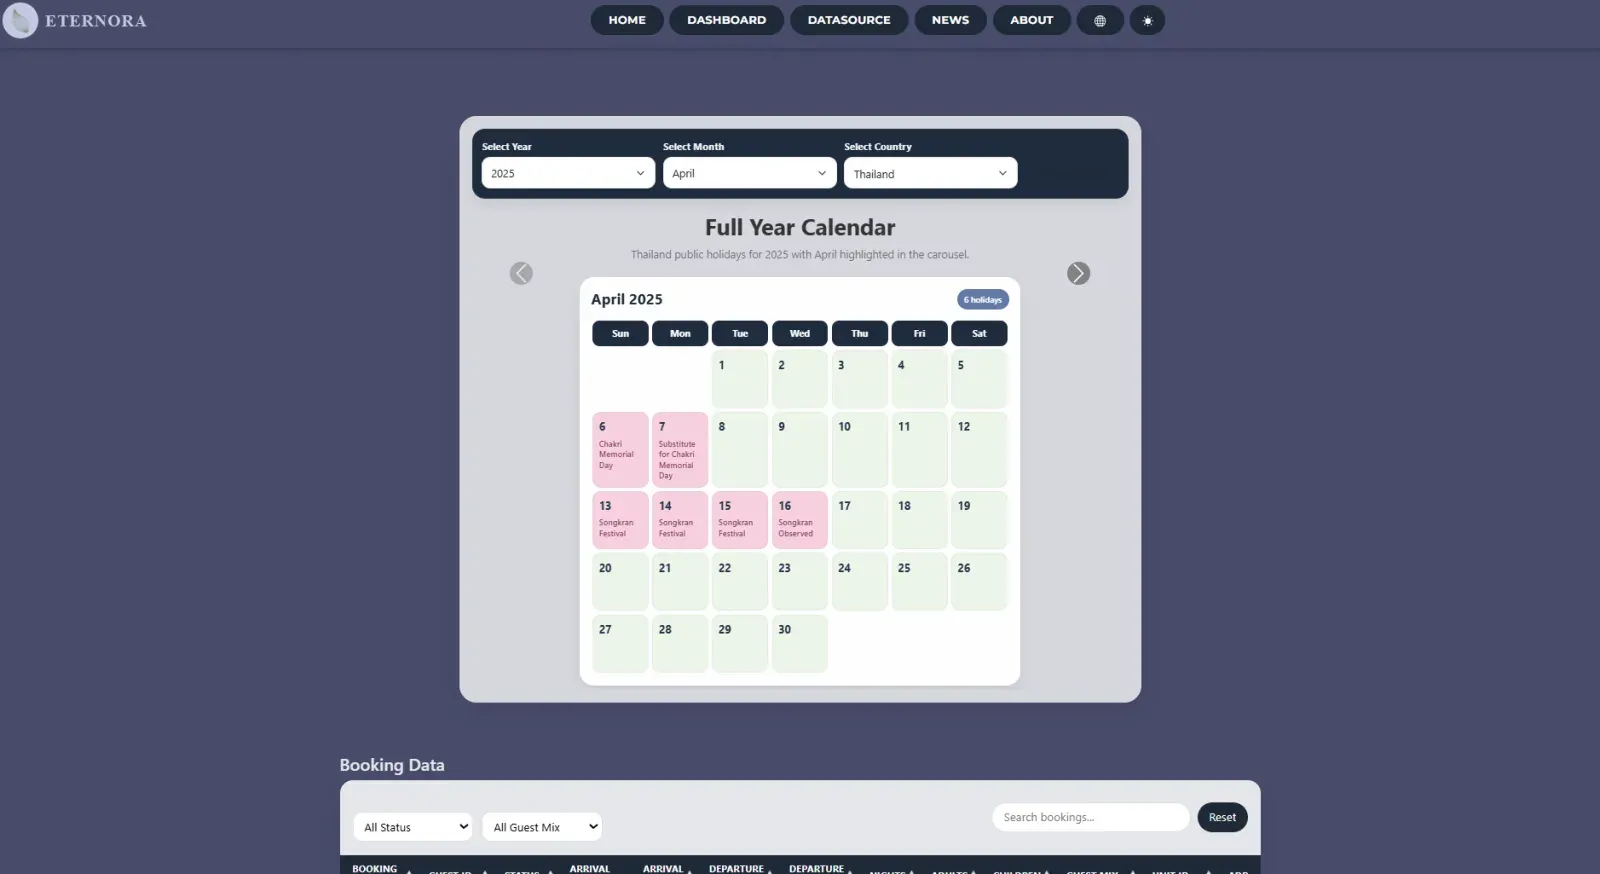
Additional features include country-specific holiday calendars for operational planning and a daily travel industry news section pulling current articles on technology, associations, and market trends.
Outcome
The platform was awarded 1st Place at the CiMSO Hospitality ERP Hackathon 2025, competing against 10 other finalist teams. The judging panel evaluated design quality, analytical depth, business relevance, and live presentation strength.
What distinguished the project was the integration depth: multilingual support, accessibility features, AI-assisted insights, and interactive analytics were not added as separate layers — they were built as a coherent system where each feature reinforced the others. The result was a dashboard that felt complete and operational rather than prototype-level.
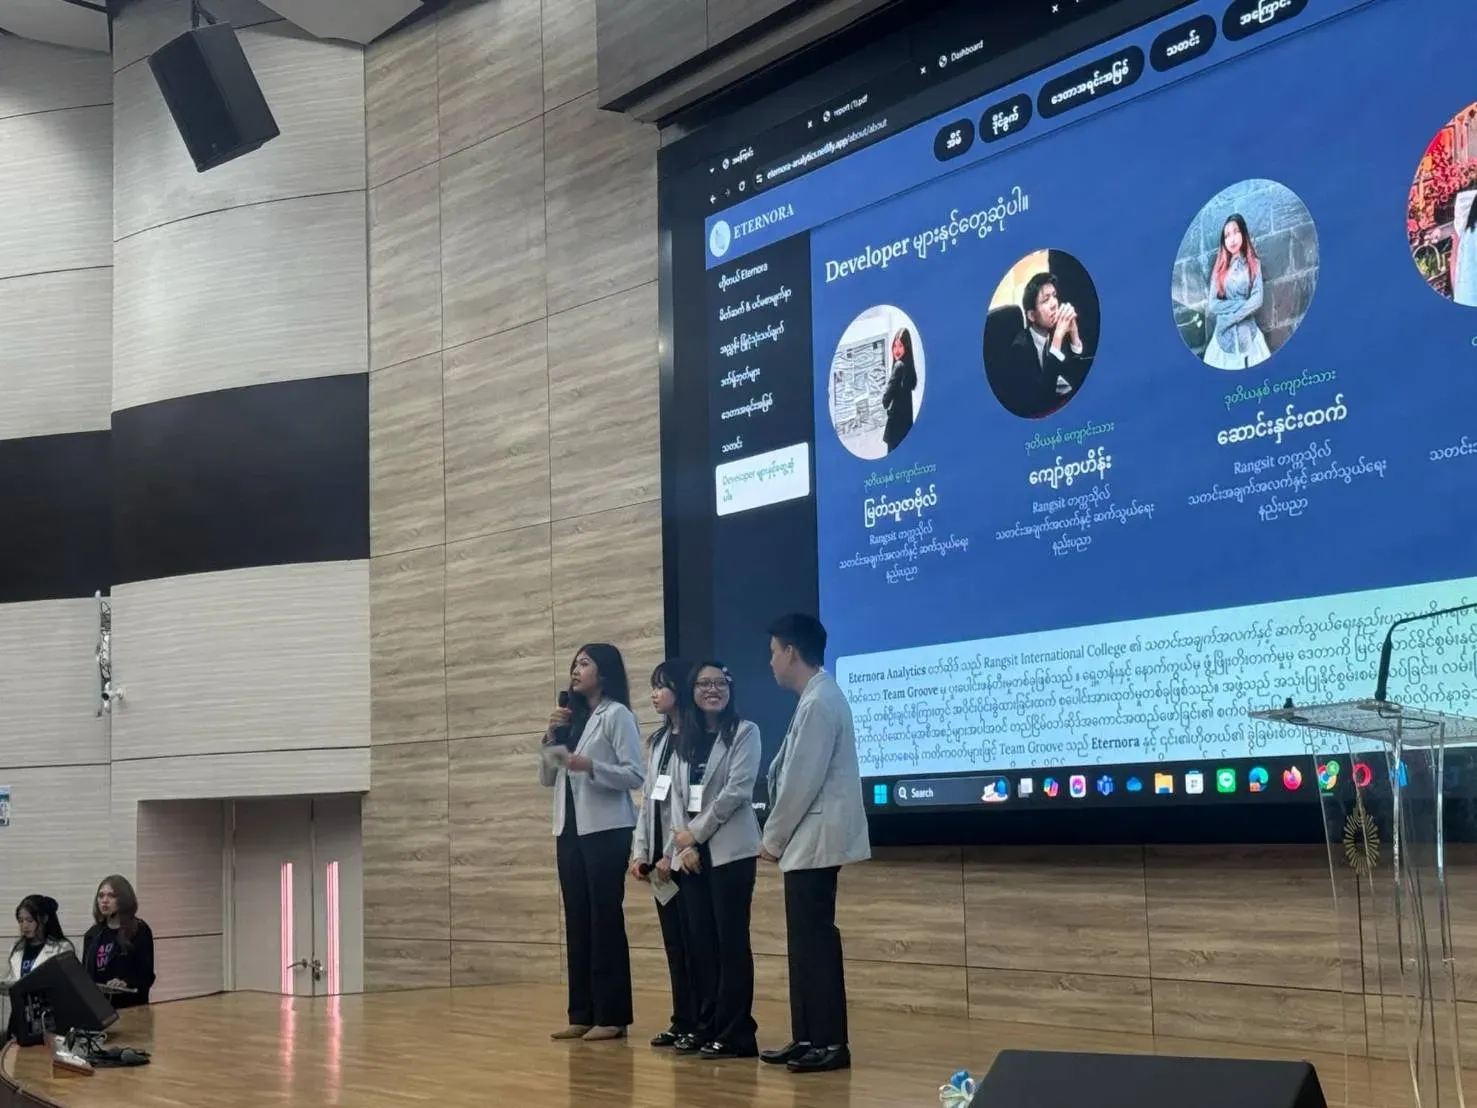

The project was subsequently selected for public showcase at the RSU Job Fair 2026, where it was demonstrated to recruiters, students, and university leadership including RSU President Dr. Attawit Ourairat.
Resources
- 1st Place — CiMSO Hospitality ERP Hackathon 2025